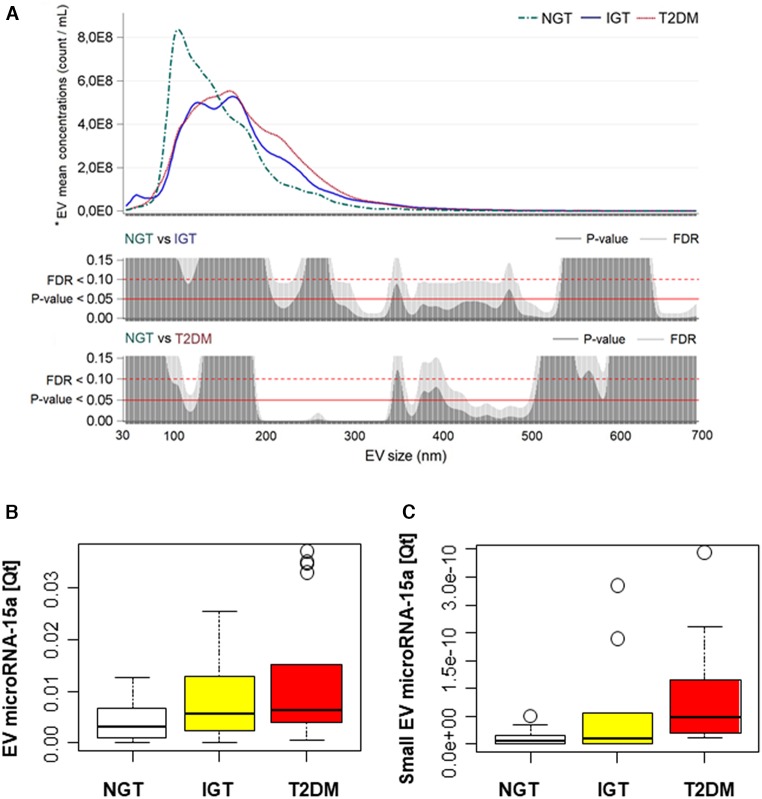
Figure 3.
T2DM associates with changes in extracellular vesicles (EVs) size distribution and microRNA-15a content. (A) EVs have been studied in a subgroup of subjects: NGT, N = 9; IGT, N = 10; T2DM, N = 10. * Reported geometric means were adjusted for age and sex. Plots showing for each diagnostic group (NGT, IGT, and T2DM) the distribution of mean vesicle concentrations for each size; vertical bar charts represent FDR and P-value for each size comparison; the red line indicates P = 0.05; the red dot line indicates FDR = 0.10. (B,C) Box plot of EV- and small EV–microRNA-15a quantity in the three diagnostic groups. EV: NGT, N = 20; IGT, N = 17; T2DM, N = 18. Small EV microRNA was obtained by normalizing the quantity of miRNA by the small EV concentration: NGT, N = 9; IGT, N = 10; T2DM, N = 10. Boxes are bordered at the 25th and the 75th percentile of the predictor variable and a median line at the 50th percentile. Whiskers extend from the box to the upper and lower adjacent values and are capped with an adjacent line. Points below and above the whiskers (10–90th percentile) are drawn as individual dots.

