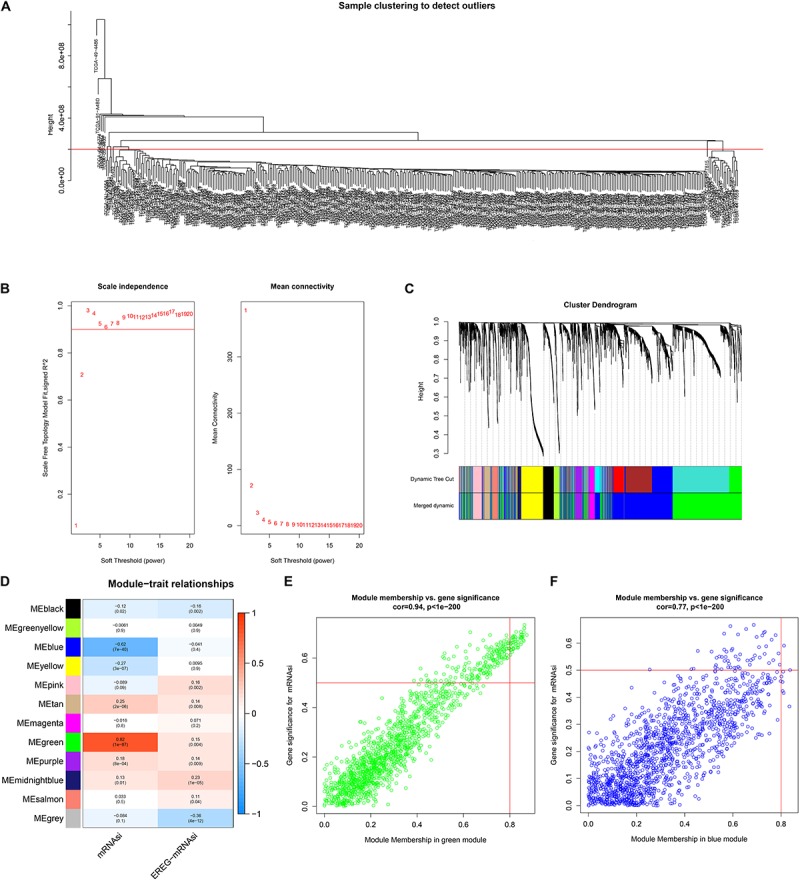
FIGURE 2.

Weighted gene coexpression network of LUAD. (A) Clustering of samples and removal of outliers. (B) Analysis of network topology for various soft-thresholding powers. The left panel shows the scale-free fit index, signed R2 (y-axis) and the soft threshold power (x-axis). β = 3 was chosen for the subsequent analysis. The right panel shows that the mean connectivity (y-axis) is a strictly decreasing function of the power β (x-axis). (C) The cluster dendrogram of genes of LUAD patients. Each branch in the figure represents one gene, and every color below represents one coexpression module. (D) Correlation between the gene module and clinical characteristics, including mRNAsi and EREG-mRNAsi. The correlation coefficient in each cell represented the correlation between the gene module and the clinical characteristics, which decreased in size from red to blue. (E) Scatter diagram for module membership vs. gene significance for mRNAsi in the green module. (F) Scatter diagram for module membership vs. gene significance for mRNAsi in the blue module. LUAD, lung adenocarcinoma; mRNAsi, mRNA expression-based stemness index; EREG, epigenetically regulated.
