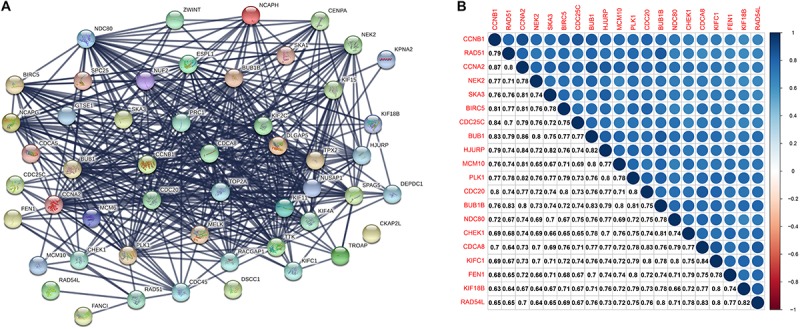
FIGURE 4.

(A) The protein-protein interaction between key genes. The thickness of the solid line represents the strength of the relationship. (B) Correlation between the top 20 key genes according to MCODE scores at the transcriptional level. MCODE, Molecular Complex Detection.
