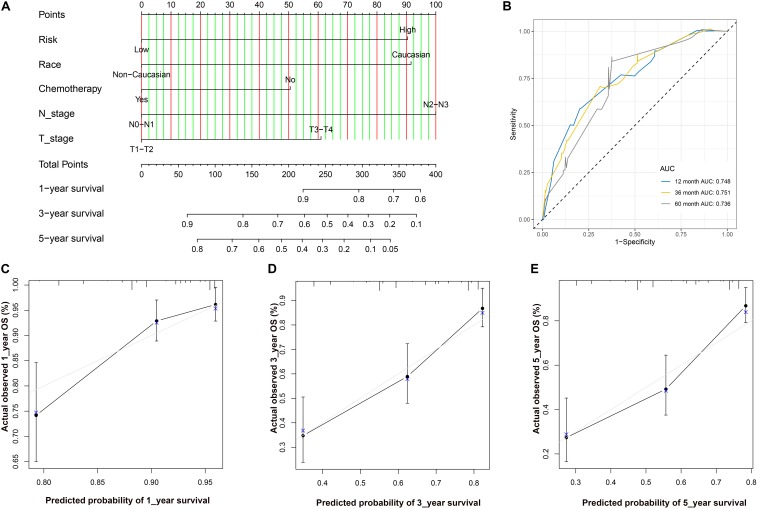
FIGURE 7.
(A) The nomogram for predicting probabilities of patients with 1–, 3–, and 5–year OS. (B) ROC curve based on the nomogram for 1–, 3–, and 5–year OS probability. (C) The calibration plots for predicting patient 1–year OS. Nomogram–predicted probability of survival is plotted on the x–axis; actual survival is plotted on the y–axis. (D) The calibration plots for predicting patient 3–year OS. (E). The calibration plots for predicting patient 5–year OS. LUAD, lung adenocarcinoma; ROC, receiver operating characteristic; OS, overall survival.

