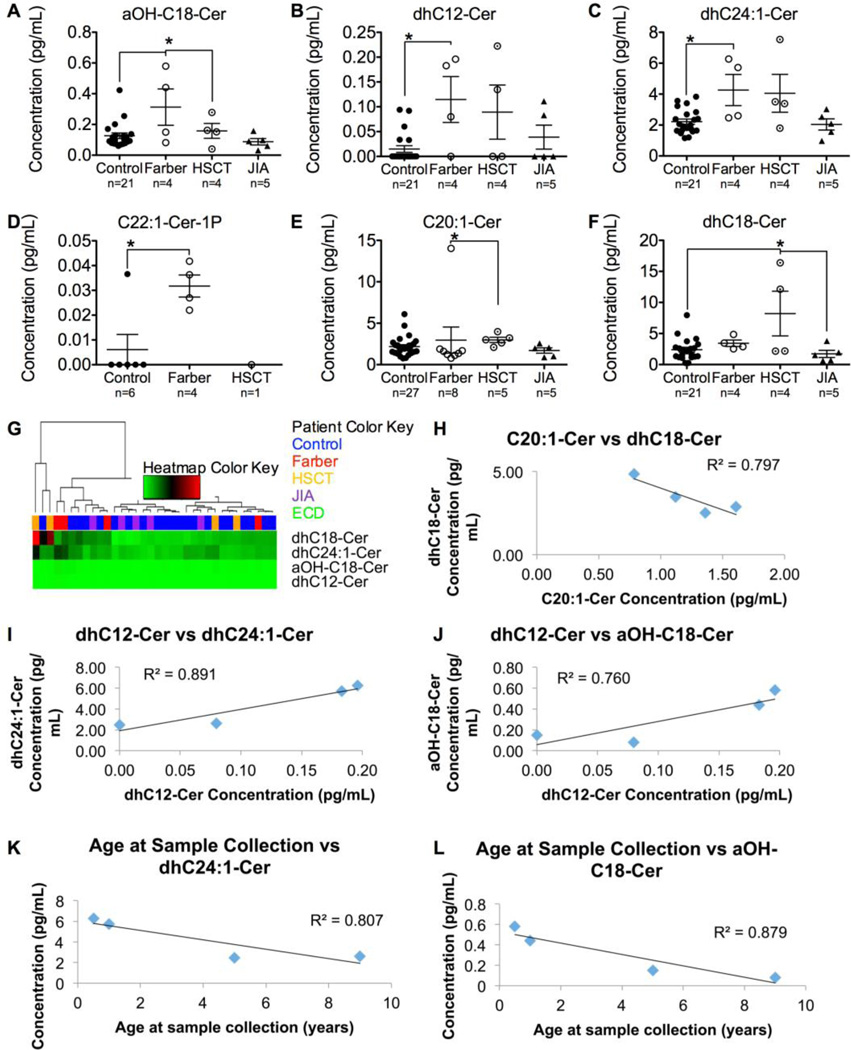
Figure 4.
Ceramide levels vary in plasma from patients with different diseases. Plasma was collected from controls (n=6–27), untreated Farber patients (n=4–8), and HSCT-treated Farber patients (n=1–5), and JIA patients (n=5). Ceramides were analyzed by mass spectrometry. a-OH-C18-Cer (A), dhC12-Cer (B), dhC24:1-Cer (C), C22:1-Cer-1P (D), C20:1-Cer (E) and dhC18-Cer (F) levels are illustrated. *p<0.05. Unbiased hierarchical clustering was performed using four significantly altered ceramides (G). A cluster dendrogram is seen at the top (branches), followed by the patient color key (single row of colored rectangles) and a heatmap of the relative ceramide levels (green, black, and red rectangles). The relative amount of each ceramide is seen horizontally corresponding to its row, where green represents relatively low expression, black medium expression, and red relatively high expression. There was a very strong negative correlation between the expression level of C20:1-Cer and dhC18-Cer (H). dhC12-Cer had a strong and very strong positive correlation, respectively, with dhC24:1-Cer (I) and aOH-C18-Cer (J). The age at sample collection correlated very strongly negatively with dhC24:1-Cer (K) and aOH-C18-Cer (L). Cer, ceramide; HSCT, hematopoietic stem cell transplanted Farber patients; JIA, Juvenile Idiopathic Arthritis.

