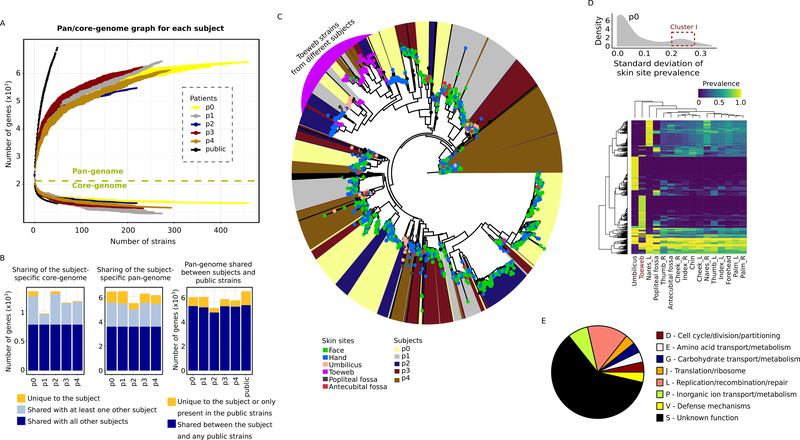
Figure 3.
Gene content diversity of the subject isolates. A, gene accumulation curves for the subject-specific pan-genomes (5476–6436 gene clusters) and core-genomes (954–1325 gene clusters), or that of the 50 public isolates, as a function of the number of sequenced isolates. Error bars show the standard deviation for 10 simulations. B, shared vs. unique subject-specific pan- and core-genes in the subject isolates and public strains. C, diversity of the subject isolates based on presence and absence of accessory genes. Leaf nodes are colored by the skin site of origin; the background color indicates the subject. A cluster containing toeweb isolates from all five subjects is highlighted in purple. D, the distribution of S. epidermidis genes in p0 with respect to their variability across skin sites (see Figure S3D for other subjects). An example cluster of genes with high variability is highlighted with a red box (boundaries arbitrarily selected), and their prevalence shown in the heatmap. Each row in the heatmap represents a unique S. epidermidis gene, and the row and column hierarchical clusters were generated based on Euclidean distances. E, the COG functional categories of representative toeweb genes (i.e. present in >40% of the toeweb isolates but <10% in any of the other skin sites, n=28). See also Figure S3 and Table S3.

