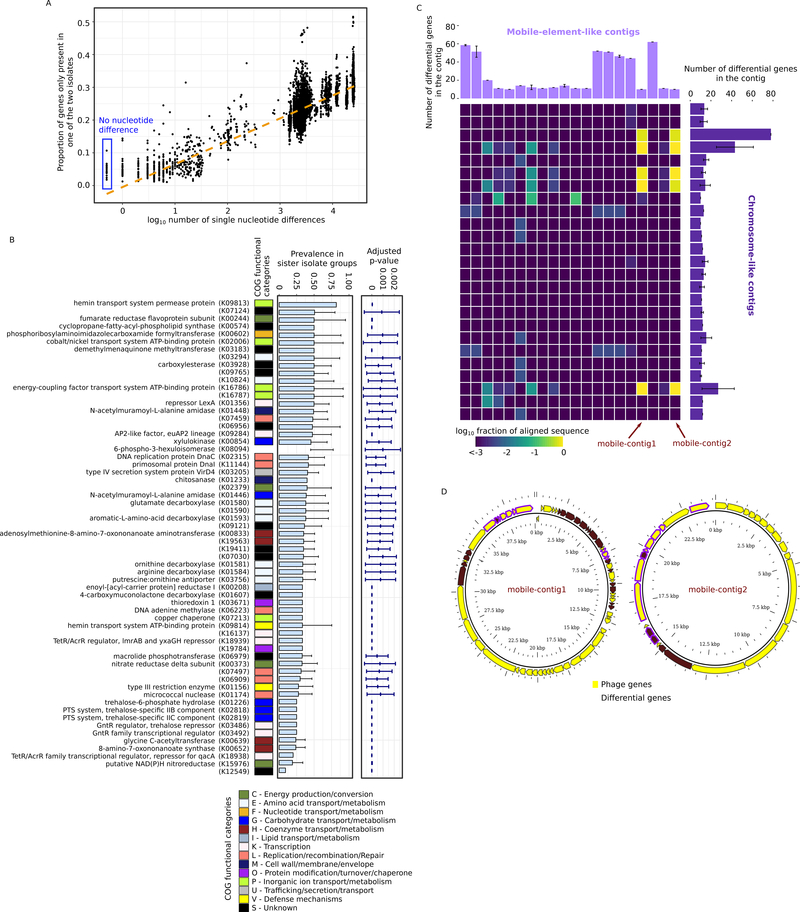
Figure 4.
Diversification of sister isolates driven by potential HGT events. A, gene content heterogeneity – the proportion of genes that are only found in one isolate of a pair of isolates – as a function of pairwise core-genome nucleotide differences. For visualization, the plot includes only 10000 randomly sampled data points. Gene content heterogeneity between sister isolates are highlighted with a blue box. B, functional annotation of the differential genes. All differential genes were mapped to KEGG orthologs (the annotations of the KEGG orthologs were shown when available) and their prevalence within sister isolate groups is shown. The p-value shows the probability of observing the differential prevalence solely due to genome incompleteness. The error bars show the standard deviation across sister isolate groups. C, presence of differential genes in the 20 unique mobile-element-like contigs identified using PlasFlow. The heatmap shows the fraction of nucleotides in the mobile-element-like contigs that was aligned to the 25 chromosome-like contigs identified containing differential genes. The error bars show the standard deviation across sister isolate groups. Two predicted phage sequences (nearly 100% alignment over contig length) are indicated by arrows. D, gene content of the predicted phage sequences indicated in Figure 4C. Note that the sequences are visualized in a circular layout but are not necessarily circular DNAs. See also Figure S4 and Table S4.

