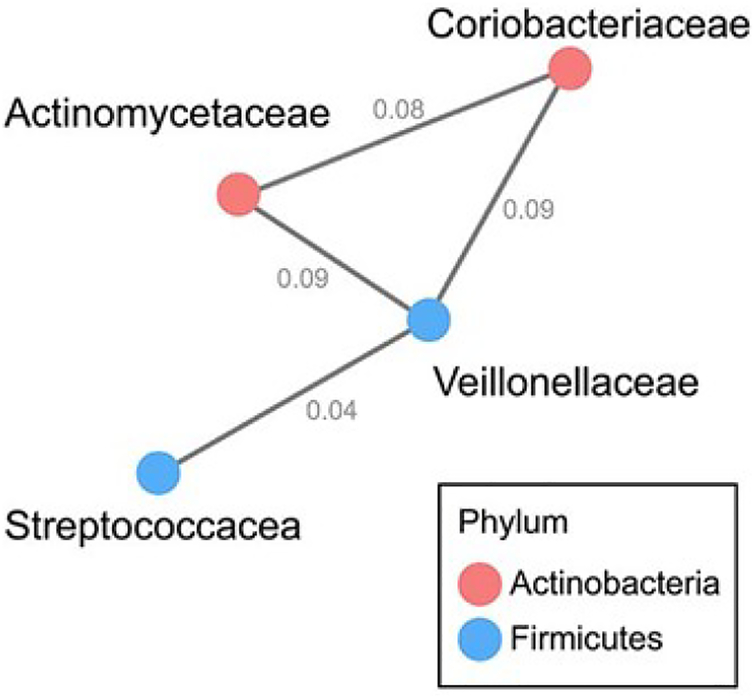
Figure 3.
Correlation network of oral taxa at the family level showing statistically significant differences (FDR P-value < 0.05) in clr-transformed relative abundance between healthy controls and anti-Ro+ mothers using the taxonomic stepdown method. Correlations were calculated using SPIEC-EASI. The presence of an edge between two nodes suggests the two families interact. Nodes are colored by phylum. Edges are labeled with values from the inverse covariance matrix.

