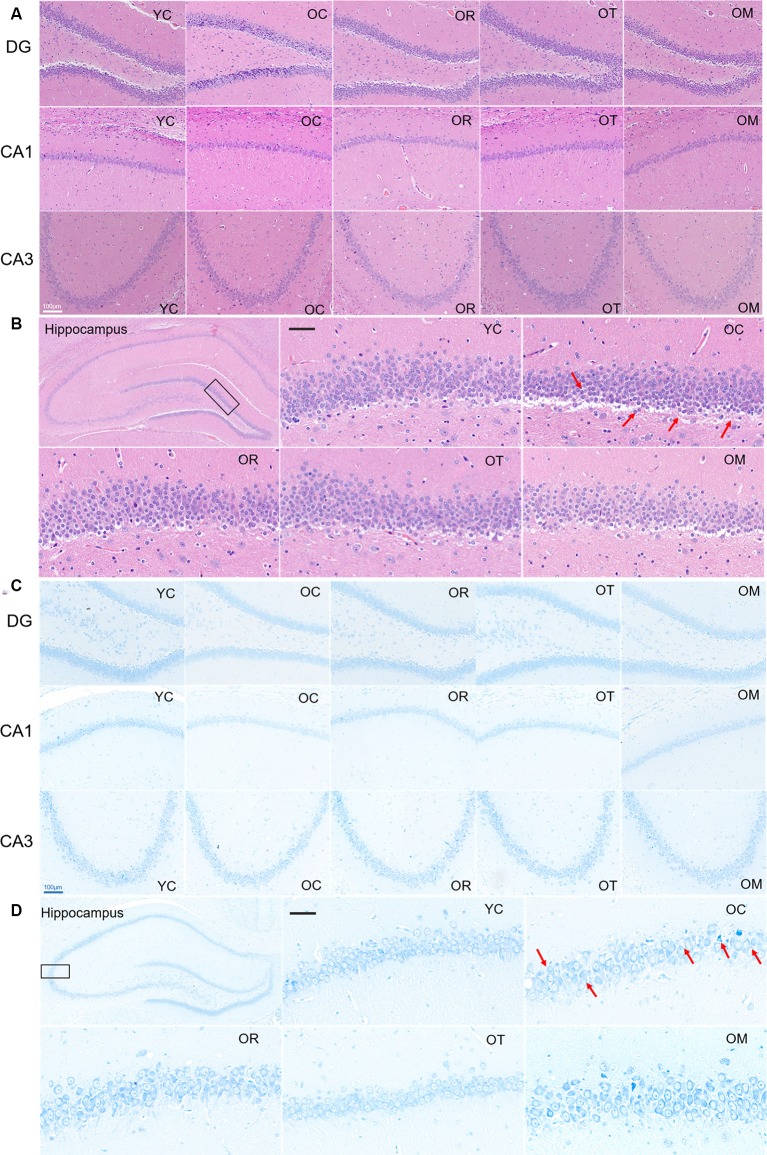
Figure 2.
Representative photomicrographs demonstrating histopathological changes in hippocampal tissues with HE staining [(A,B); scale bar, 50 μm] and Nissl staining [C,D); scale bar, 100 μm]. Photographs from panels (B,D) were acquired under a light microscope (400×). All arrows in the images denoted the disordered neurons with nucleus condensation in the rats from OC group when compared with the normal hippocampal neurons in the rats from YC group and OR, OT and OM groups.

