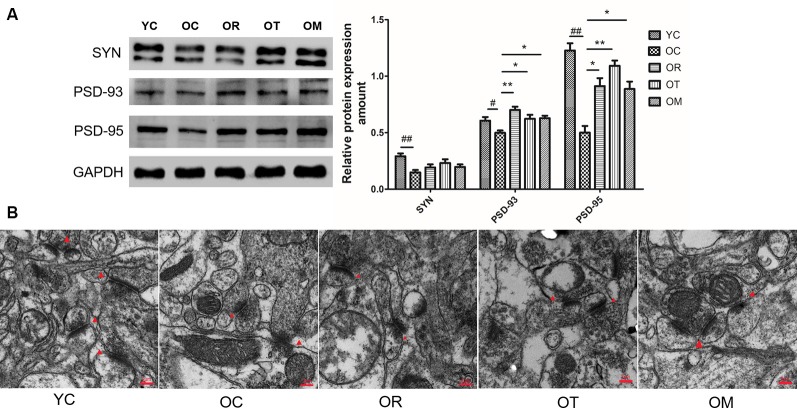
Figure 4.
The effect of different exercise intervention on synaptotoxicity and synaptic morphology in hippocampal tissue. (A) SYN, PSD93 and PSD95 were subjected to Western blot analysis using corresponding antibodies. The data were expressed as mean ± standard deviation (M ± SD) from independent experiments performed in triplicate. Equal protein loading was confirmed by GAPDH. (B) Representative images of hippocampal tissues were examined by transmission electron microscope. The effect of exercise intervention on synapse (red triangle arrows) is indicated. #p < 0.05, ##p < 0.01 relative to the YC group; *p < 0.05 and **p < 0.01 relative to the OC group.

