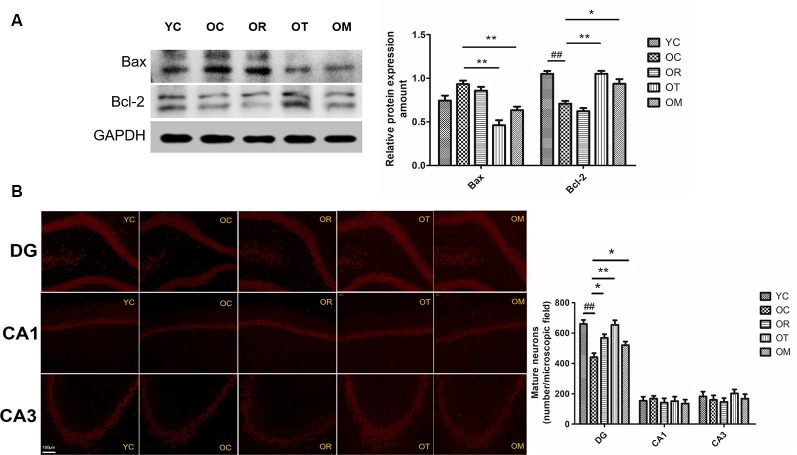
Figure 7.
Protein expression levels of Bax and Bcl-2 in hippocampal tissues of the rats from different groups. (A) Images showed representative Western blots and bar graphs obtained from semi-quantitative image analysis. All data were presented as mean ± standard deviation (M ± SD) from independent experiments performed in triplicate. (B) Representative images of dentate gyrus (DG), CA3, and CA1 regions stained with NeuN from brains of the rats from different groups (200× magnification). ##p < 0.01 relative to the YC group; *p < 0.05 and **p < 0.01 relative to the OC group.

