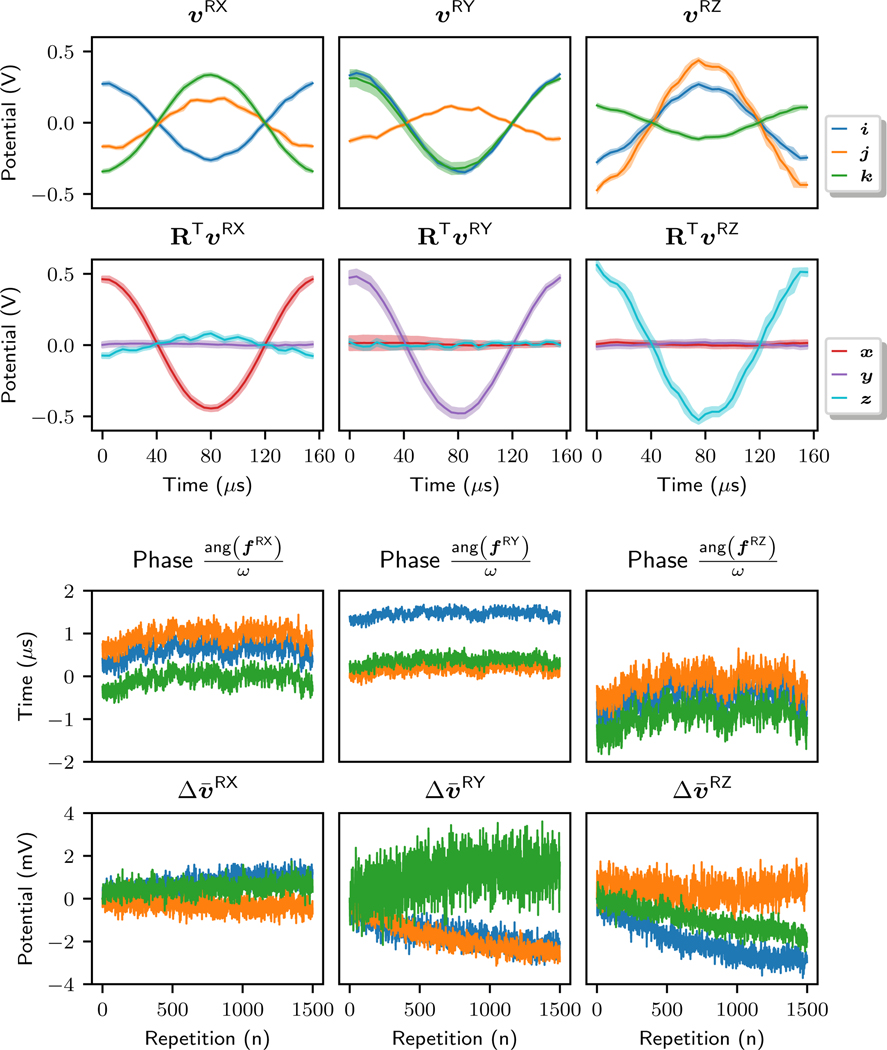
Fig. 9.
Data captured by the WRAD over 1500 lines of k-space at a repetition time of 60 ms. The top two plots show the mean value and shaded area, bounding a region of ±10 standard deviations from the mean, for each sample point of each readout. The (top row) are the raw values captured in the WRAD co-ordinate frame and the (second row) are the raw values transformed into the gradient co-ordinate frame using the magnetometer and x gradient pulse voltage vector to construct R. The bottom two rows show the Goertzel filter result for each voltage waveform. The (third row) shows the phase (scaled to μs) and the (bottom row) is the change in amplitude relative to the start of the scan in millivolts.

