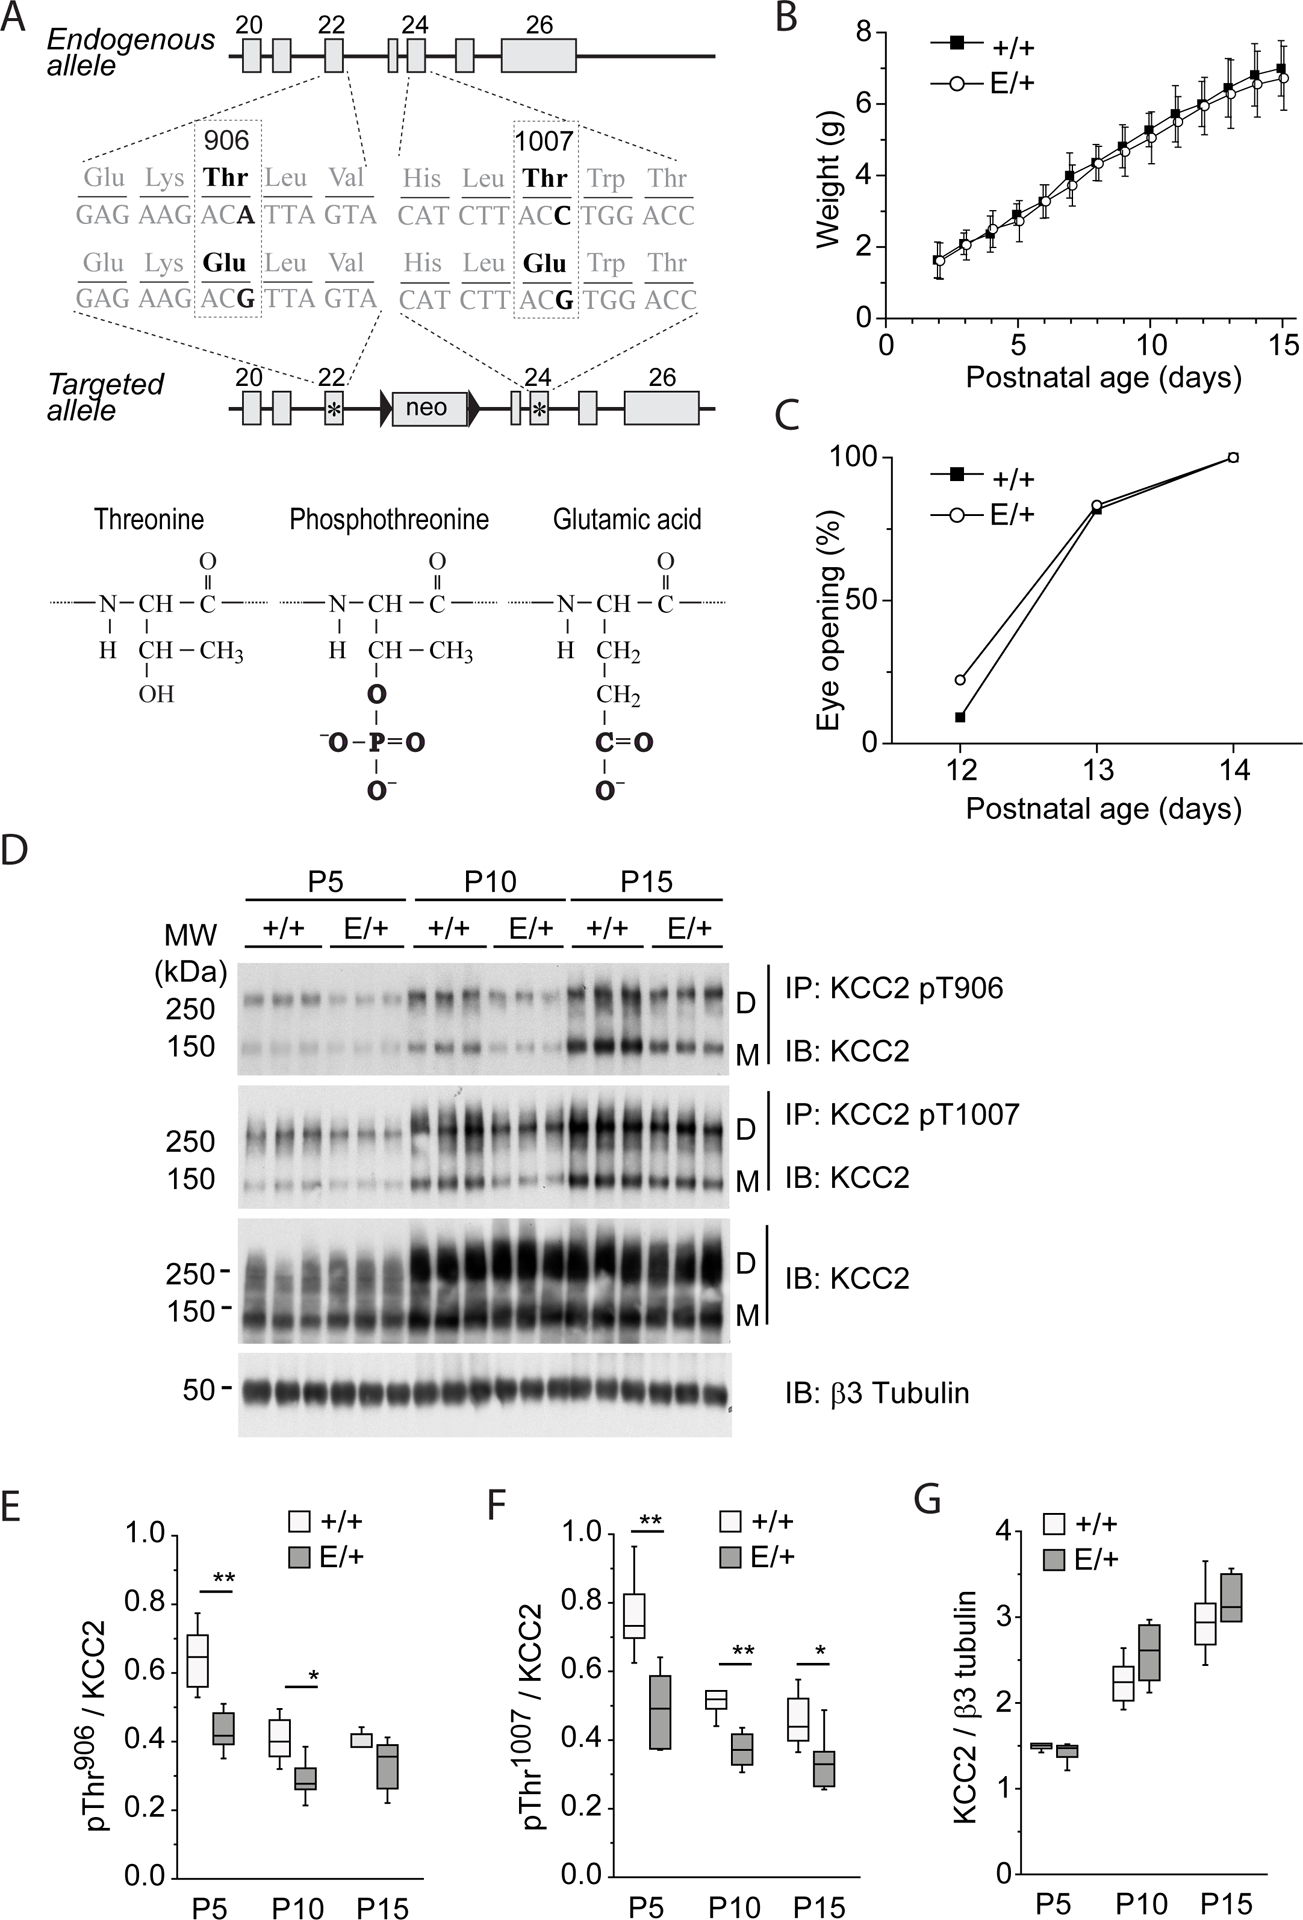
Figure 1. Characterization of KCC2E/+ phospho-mimetic mice.

(A) Mutagenesis scheme. Thr906 and Thr1007 are located in exons 22 and 24, respectively, and are preserved in endogenous allele. T906E and T1007E mutations are located in the second targeted allele that contains a Neomycin selection cassette excised in vivo by Cre recombinase. (B) Weight gain by KCC2E/+ and KCC2+/+pups. The plot represents mean±SD of values obtained from 11 KCC2+/+ pups [4 litters] and 18 KCC2E/+ pups [4 litters]. Two-way ANOVA analysis revealed no statistically significant difference between KCC2E/+ and KCC2+/+pups (P=0.18, F=1.84) and strong difference of weight during development (P=1.1E-8, F=205.39). (C) Age dependence of eye opening, an external sign of normal CNS maturation in vertebrates (69), in KCC2E/+ and KCC2+/+pups. The plot represents percentage of animals with open eyes (N=11 KCC2+/+ pups [4 litters] and 18 KCC2E/+ pups [4 litters]). The Chi-square analysis revealed no statistically significant difference between KCC2E/+ and KCC2+/+pups (P=0.83). (D) Abundance of KCC2 in KCC2E/+ and KCC2+/+pups. Hippocampal lysates from KCC2E/+ and KCC2+/+ at the indicated time pointspoints were subjected to immuno-precipitation (IP) with the indicated phosphorylation site-specific antibodies recognizing pThr906- or pThr1007- KCC2, and the immuno-precipitated monomer (“M”) and dimer (“D”) products were detected with the pan-KCC2 antibody (IB). The same antibody was used for detection of total KCC2 protein abundance in the same input material. An antibody recognizing neuron specific β3 tubulin was employed to normalize total protein amounts for sample loading. Each condition illustrates migration of extracts from 3 mice. (E to G) Developmental abundance of immunoprecipitated phosphorylated forms of Thr906 (E), Thr1007 (F) and total KCC2 (G). Data are from N=6 mice per condition from 4 different litters. * P <0.05 and ** P <0.01 indicate statistical difference between KCC2+/+ and KCC2E/+ littermates for pairwais groups, Mann-Whitney test. The Kruskal–Wallis test applied for analysis of P5 to P15 samples in G revealed significant age-dependent increase of total KCC2 both in KCC2+/+ (P=6.3E-4) and KCC2E/+ (P=7.6E-4) littermates. For details on statistical analyses, see table S1.
