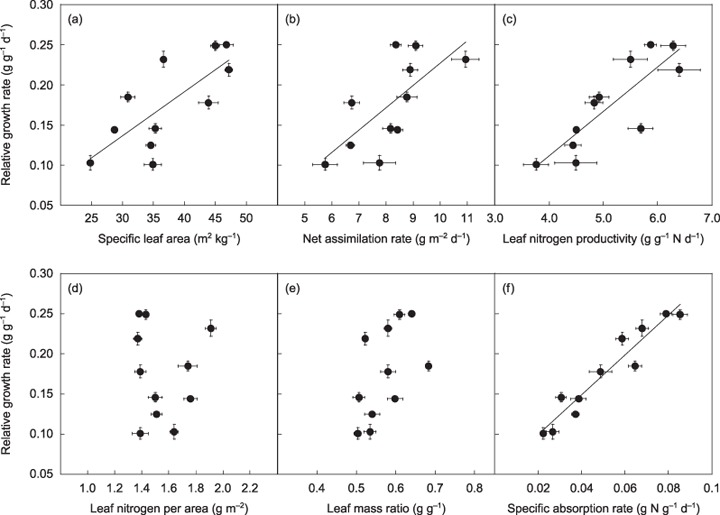
Figure 1.

Relationships between relative growth rate and specific leaf area (a), net assimilation rate (b), leaf nitrogen productivity (c), leaf nitrogen per area (d), leaf mass ratio (e) and specific absorption rate (f). Bold lines represent regression lines for statistically significant relationships. Regression relationships: (a) y = 0.005x − 0.028 (r 2 = 0.55, P = 0.009); (b) y = 0.028x − 0.050 (r 2 = 0.43, P = 0.017); (c) y = 0.055x − 0.11 (r 2 = 0.67, P < 0.001); (d) y = 0.021x + 0.14 (r 2 = 0.004, P = 0.86); (e) y = 0.55x − 0.14 (r 2 = 0.25, P = 0.069); (f) y = 2.48x + 0.05 (r 2 = 0.91, P < 0.001). Bars represent ± SE of the mean.
