
Figure 2.
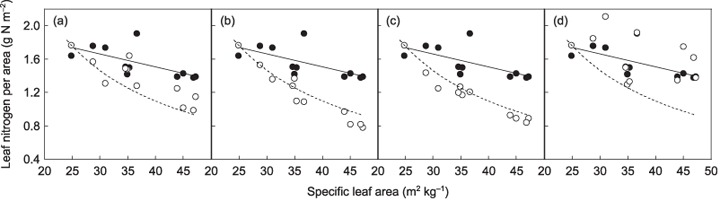
Simulations based on the balanced growth hypothesis. (a) Measured and calculated area‐based leaf nitrogen concentration (LNCa) in simulations 1 and 2. Simulation 1 estimated the effect of specific leaf area (SLA) on LNCa, and simulation 2 estimated the coupled effects of SLA and leaf : root ratio. Closed circles, measured LNCa; open circles, calculated LNCa in simulation 2. A broken line represents the result of simulation 1. A solid line represents the regression relationship between measured LNCa and SLA, y = −0.016x + 2.14 (r 2 = 0.42, P = 0.032). (b) Calculated LNCa in simulation 3 that estimated the coupled effects of SLA and leaf nitrogen productivity (LNP). Open circles, calculated LNCa in simulation 3. Other symbols and lines were as in (a). (c) Calculated LNCa in simulation 4 that estimated the coupled effects of SLA and a. Open circles, calculated LNCa in simulation 4. Other symbols and lines were as in (a). (d) Calculated LNCa in simulation 5 that estimated the coupled effects of SLA and specific nitrogen absorption rate of roots (SAR). Open circles, calculated LNCa in simulation 5. Other symbols and lines were as in (a).