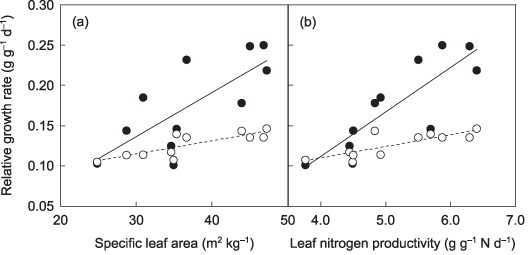
Figure 4.

Simulated relationships between relative growth rate and specific leaf area (a), and relative growth rate and leaf nitrogen productivity (b). Closed circles, measured values; open circles, simulated values. For simulated relative growth rate (RGR) values, area‐based leaf nitrogen concentration (LNCa) was first calculated using Eqn 4, assuming that parameters other than specific nitrogen absorption rate of roots (SAR) were constant across species (assuming that there was no positive effect of SAR); RGRs were then calculated with Eqn 2, assigning these LNCa values. Regression relationships: (a) y = 0.005x − 0.028 (r 2 = 0.55, P = 0.009) for measured values, y = 0.002x + 0.069 (r 2 = 0.70, P = 0.001) for calculated values; (b) y = 0.028x − 0.050 (r 2 = 0.43, P = 0.017) for measured values, y = 0.013x + 0.060 (r 2 = 0.60, P = 0.003) for calculated values.
