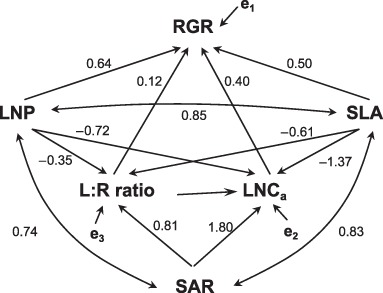
Figure 7.

A hypothetical path model for leaf and root properties. Single‐headed arrows represent direct relationship or causality. Double‐headed arrows represent indirect relationship or covariation. RGR, relative growth rate; SLA, specific leaf area; LNP, leaf nitrogen productivity; LNCa, leaf nitrogen per area; L : R ratio, leaf : root ratio; SAR, specific absorption rate. e represents an error term. Numbers beside each arrow represent standardized path coefficients.
