Figure 1.
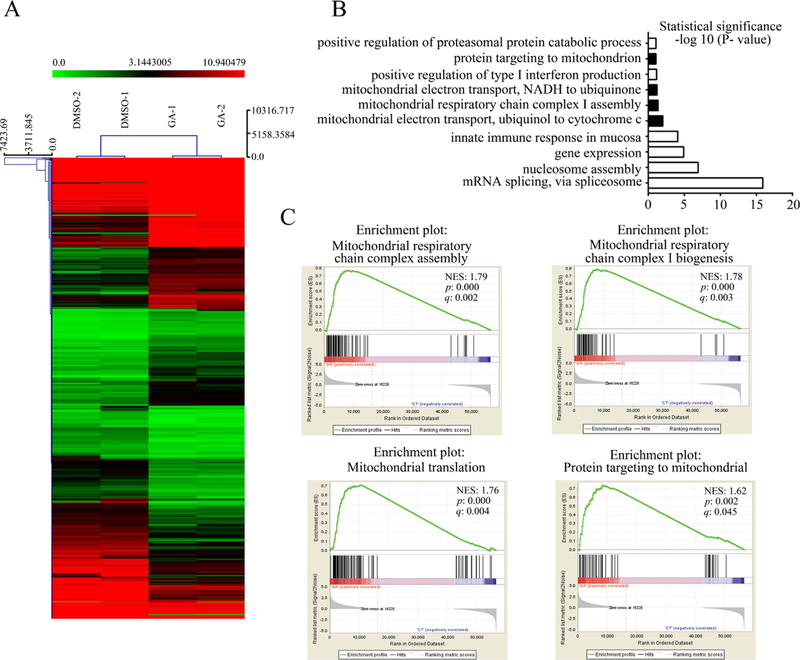
GO and gene sets enrich analysis of gene expression profiling in GA- and DMSO-treated HeLa cells. (A) Heat map of differential gene expression in GA- and DMSO-treated HeLa cells (n = 2). (B) Most upregulated biological processes by DAVID GO analyses. (C) GSEA shows the biological processes enriched in GA-treated cells. (NES: normalized enrichment score; p: nominal p-value; q: false discovery rate q-value.)

