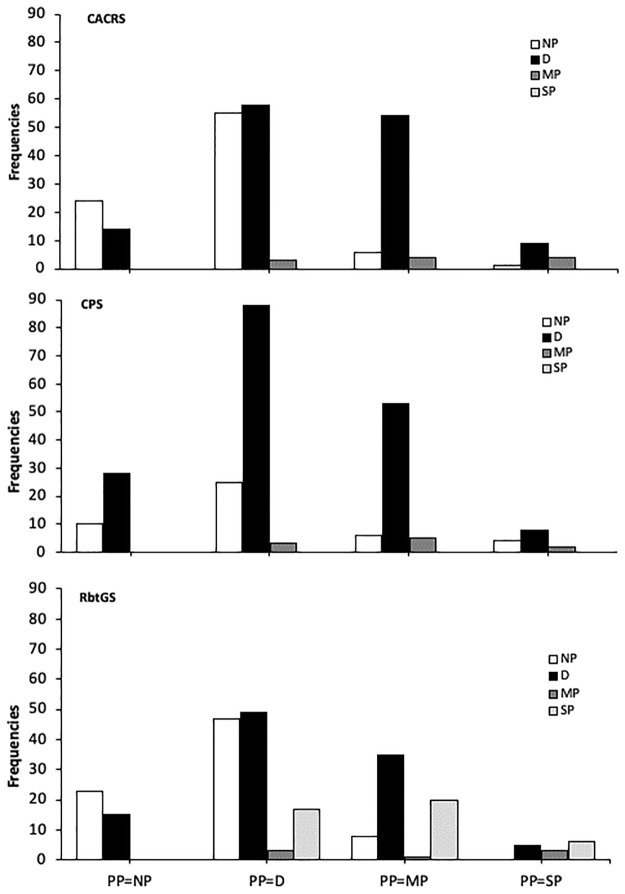
Fig 1. Distribution of the results obtained using CANCRS, CPS, and RbtGS related to presumptive pain classes (PP).
CANCRS: results show that frequencies are not randomly obtained, but diagnosis obtained by assessing pain with the CANCRS are related to PP (p≤0.05). CPS: results show that frequencies could be randomly obtained, and that there is no relation between CPS and PP (p>0.005). RbtGS: results show that frequencies are not randomly obtained, but diagnosis obtained by assessing pain with the RbtGS are related to PP (p≤0.05).

