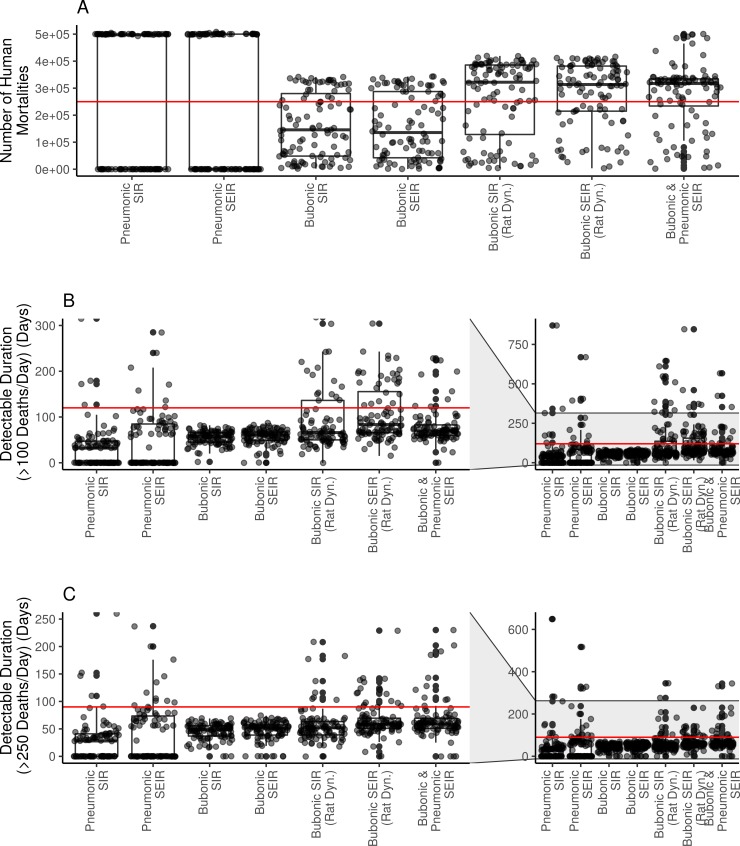
Fig 2. Box and whisker plot showing results of uniform LHS sampling.
(A) number of human mortalities; (B) detectable outbreak duration (>100 deaths per day, non-consecutive) with inset including outliers (up to 5000 days); and (C) detectable outbreak duration (>250 deaths per day, non-consecutive) with inset including outliers (up to 5000 days). Red lines depict estimated comparison values from historical primary source accounts: (A) 250,000 mortalities; (B) 4 months or 120 days of mortality exceeding 100 deaths per day; and (C) 3 months or 90 days of mortality exceeding 250 deaths per day.

