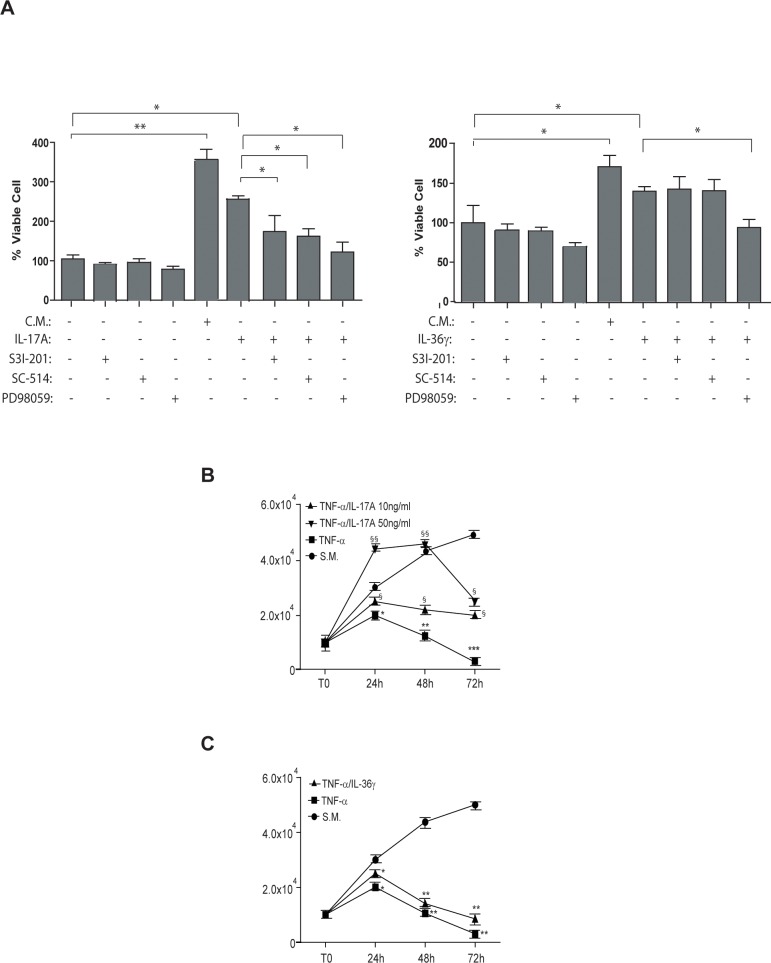
Fig 2. IL-17A and IL-36γ induce HDMEC proliferation through common and specific intracellular signaling pathways.
A. CyQUANT proliferation assay was performed to determine HDMEC proliferation of cells grown in EGM as a complete medium (C.M.) or in EBM as a starvation medium (S.M.) in presence of IL-17A (50 ng/ml; left graph), IL-36γ (50 ng/ml; right graph) with addition of the S3I-201 STAT3 inhibitor, the SC-514 NF-κB inhibitor or the PD98059 ERK1/2 inhibitor for 48 hours. As controls, S3I-201, SC-514 or PD98059 were used alone in S.M. Data are shown as the percentage of mean values of fluorescence intensity obtained from three independent experiments ± SD. *p≤0.05, ** p≤0.01 calculated by One-way ANOVA comparing HDMEC grown in S.M. with HDMEC grown in C.M.; IL-17A- (left graph) or IL-36γ - treated cells (right graph) with untreated cells or with each inhibitor treatment as indicated by the connecting bars. B. HDMEC cells were grown in S.M. in the presence or absence of 10 ng/ml TNF-α, administered alone or in combination with 10 or 50 ng/ml IL-17A, for the indicated time points. C. HDMEC cells were grown in S.M. in the presence or absence of 10 ng/ml TNF-α, administered alone or in combination with 50 ng/ml IL-36γ, for the indicated time points. In B and C, proliferation was evaluated by cell counts using trypan blue exclusion test. Data are shown as mean values of viable cell counts obtained from three independent experiments ± SD as calculated by One-way ANOVA. In (B) *p≤0.05, **p≤0.01 comparing TNF-α-treated cells with S.M.; §p≤0.05, §§p≤0.01 comparing TNF-α/IL-17A 10 ng/ml and TNF-α/IL-17A 50 ng/ml with TNF-α-treated group; in (C) *p≤0.05, **p≤0.01 comparing TNF-α or TNF-α/ IL-36γ with S.M.

