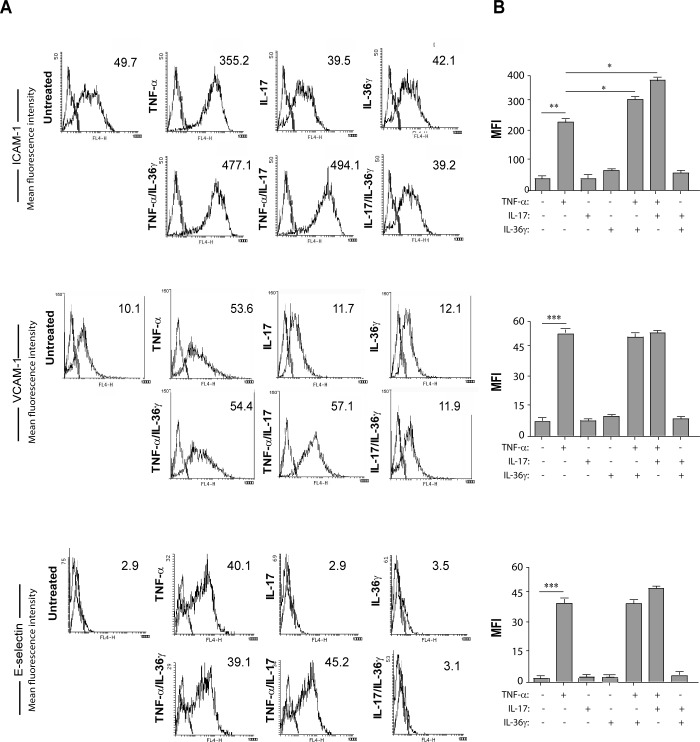
Fig 3. Both IL-17A and IL-36γ in combination with TNF-α increase ICAM-1 expression.
A. Flow cytometry analysis of ICAM-1, VCAM-1 and E-Selectin expression was performed on HDMECs stimulated for 48 hours with IL-36γ (50 ng/ml), IL-17A (50 ng/ml) or TNF-α (10 ng/ml) alone or in different combinations, i.e. TNF-α/IL-36γ, TNF-α/IL-17A or IL-17A/IL-36γ. Data shown are expressed as mean fluorescence intensity (MFI) and represent one out of three independent experiments. B. Graphs show MFI values of three different experiments performed independently ± SD. *p≤0.05, **p≤0.01, ***p≤0.005, as calculated by Kruskal Wallis analysis, comparing TNF-α-treated group with S.M. and TNF-α/IL-36γ- or TNF-α/IL-17A- with TNF-α- treated group.

