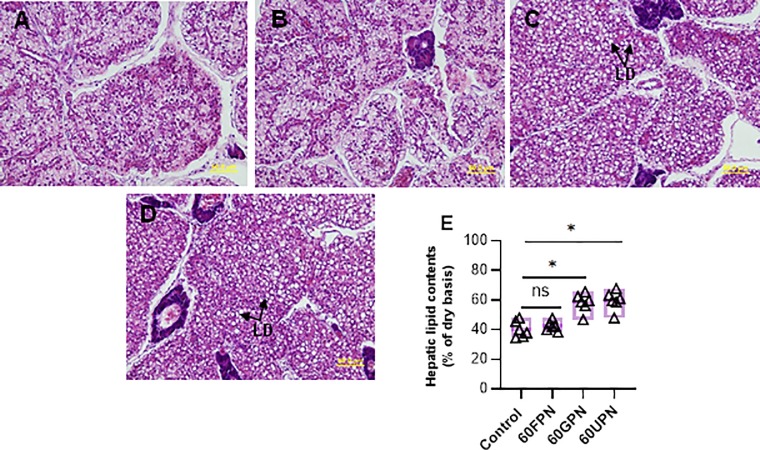
Fig 2. Histological structure of the liver of juvenile barramundi fed control, 60FPN, 60GPN and 60UPN diets (A-D, respectively).
Black arrow in liver micrographs indicates large vacuoles in hepatic cells (H&E staining, 40 x magnification, scalebar = 50μm). Variation in the hepatic lipid content in fish fed control, 60FPM, 60GPM and 60UPM after 8 weeks (E). Significant at *P < 0.01 (one-way ANOVA with Dunnetts multiple comparisons test). ns: not significant.

