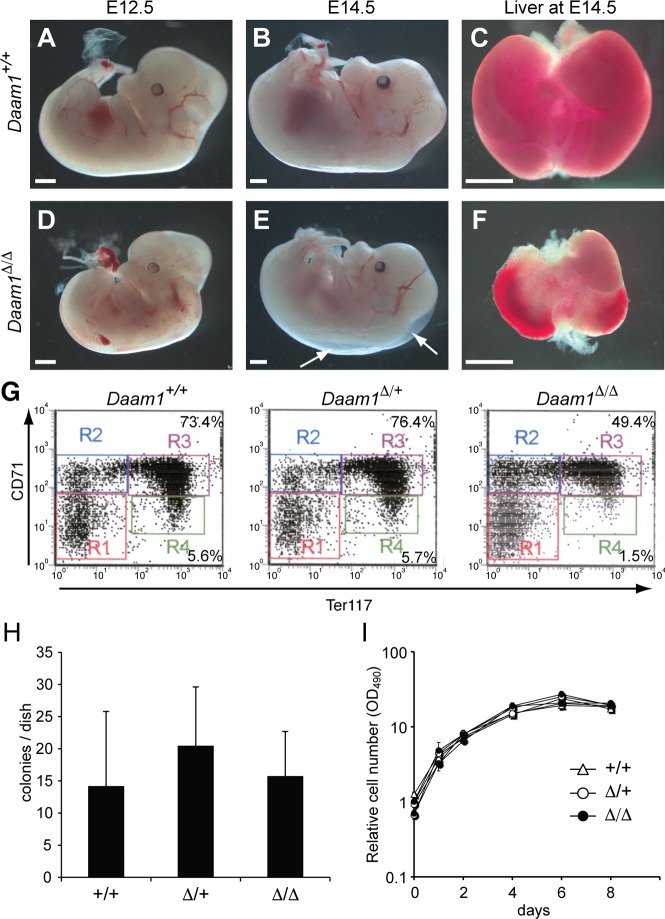
Fig 1. Observation of Daam1-deficient embryos.
(A-E) Daam1+/+ (A-C) and Daam1Δ /Δ (D-F) embryos at E12.5 (A, D), E14.5 (B, E) and livers at E14.5 (C, F). Edema found in Daam1Δ /Δ embryo is indicated by arrows (E). (G) Representative results of fetal liver-derived erythrocyte differentiation analyzed by flow cytometry. Percentages of the cells gated in R3 and R4 were as follows: Daam1+/+: R3 (CD71hi;Ter119hi) = 76.5 ± 2.4%, R4 (CD71lo;Ter119hi) = 6.4 ± 0.8%; n = 5, Daam1Δ/+ R3 = 73.8 ± 6.8%, R4 = 6.3 ± 1.7%; n = 4, and DaamΔ /Δ:R3 = 64.2 ± 9.0%, R4 = 3.3 ± 1.6%; n = 5. Daam1Δ /Δ erythrocytes were significantly reduced compared with Daam1+/+ and Daam1Δ/+: t-test R3 p<0.01, R4 p<0.002. (H) BFU-E colony formation assay using fetal liver cells. Daam1+/+: n = 5, Daam1Δ/+: n = 5, and Daam1Δ/Δ: n = 4. Standard deviations are shown as error bars. No significant difference was observed. (I) MEFs proliferation assay. Relative cell numbers were measured by MTS assay. Results were normalized by day 0 as 1. Results represent analyses of 5 or more embryos of each genotype. No significant difference was observed.

