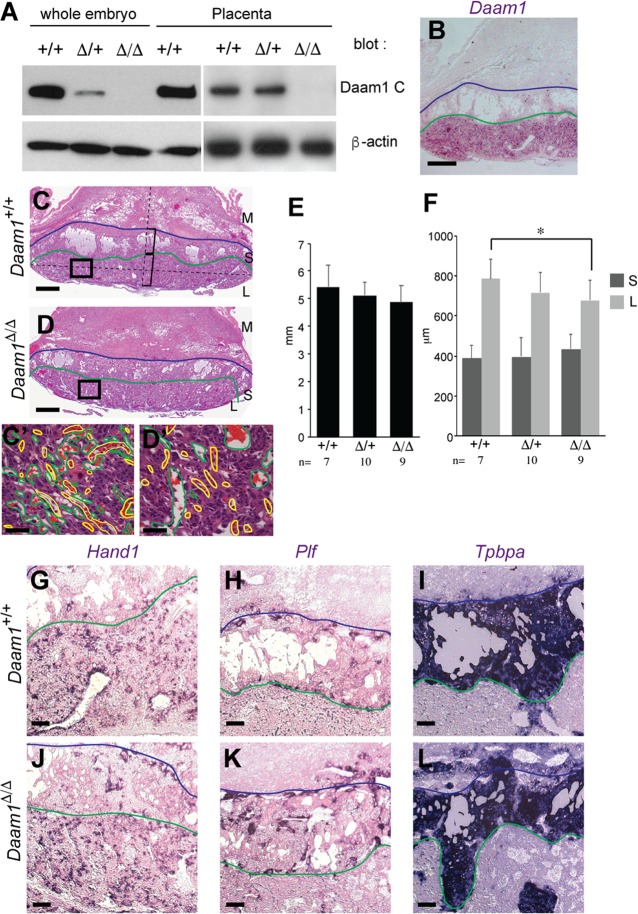
Fig 2. Placental developmental defects in Daam1-deficient mice.
(A) Western blot analysis for Daam1 (top) and β-actin (bottom). Whole embryo lysates and the embryonic part of the placenta from indicated genotypes at E10.5 were used.(B) In situ hybridization of wild-type placenta sections using the Daam1 probe. (C) Daam1+/+ and (D) Daam1Δ/Δ placentas at E12.5. High magnification images’ (C’, D’) positions are indicated as boxes on C and D. Maternal blood sinuses (green) and fetal blood vessels (yellow) are labeled with lines on C’ and D’. (E) Size of the placenta of each genotype which was measured as the distance between edges of the boundary between the spongiotrophoblast and labyrinthine layers. (F) Thickness of the spongiotrophoblast layer (S) and labyrinthine layer (L) in each genotype. The thickness of each layers was measured on the line that connected the center of the boundary between spongiotrophoblast and labyrinthine layers and the thickest part of placenta as shown in C. t-test *: p<0.05. (G-L) In situ hybridization of Daam1+/+ (G-I) and Daam1Δ/Δ (J-L) placenta sections using Hand1 (G, J), Plf (H, K) and Tpbpa (I, L) probes. Blue lines depict the boundary between the maternal decidua (M) and spongiotrophoblast layer (S), and green lines depict the boundary between spongiotrophoblast and labyrinthine layers (L). Scale bar = 200 μm in B, and G-L. 500 μm in C and D. 50 μm in C’ and D’.

