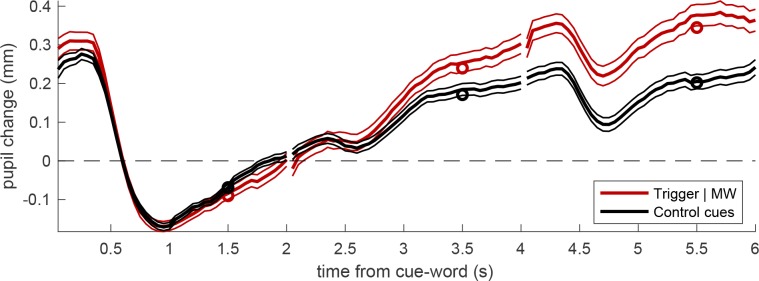
Fig 2. Pupil traces aligned to the average pupil diameter during the presentation of the verbal cue.
Thick lines give the average across all trials, thin lines show the s.e. and circles show the average values entered in the LMM analysis (average over the second half of each trial). The two traces give the average pupil diameter following a verbal cue that was later reported as triggering a MW episode, or a verbal cue presented during a supposedly on-task period, i.e. the period immediately following the resuming of the task after a self-caught interruption and MW report.

