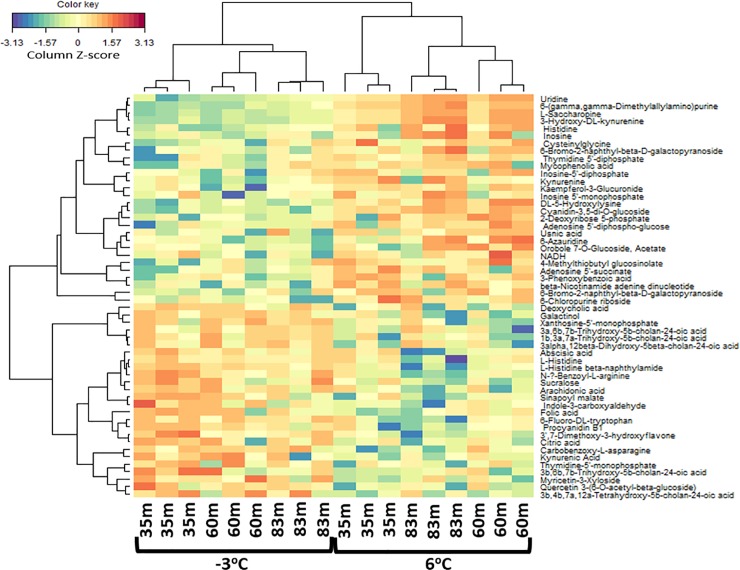
Fig 9. A heatmap illustrating from the hierarchical clustering analysis of metabolites in permafrost microbial cells at the three locations and thawed from -3 oC to 6 oC.
The map shows a scaled Z-scores intensity values of 54 metabolites of the filtered dataset under the ESI- mode. The negative (blue) value indicates intensity that lie below the mean and the positive (red) values indicate an intensity that is above the mean.

