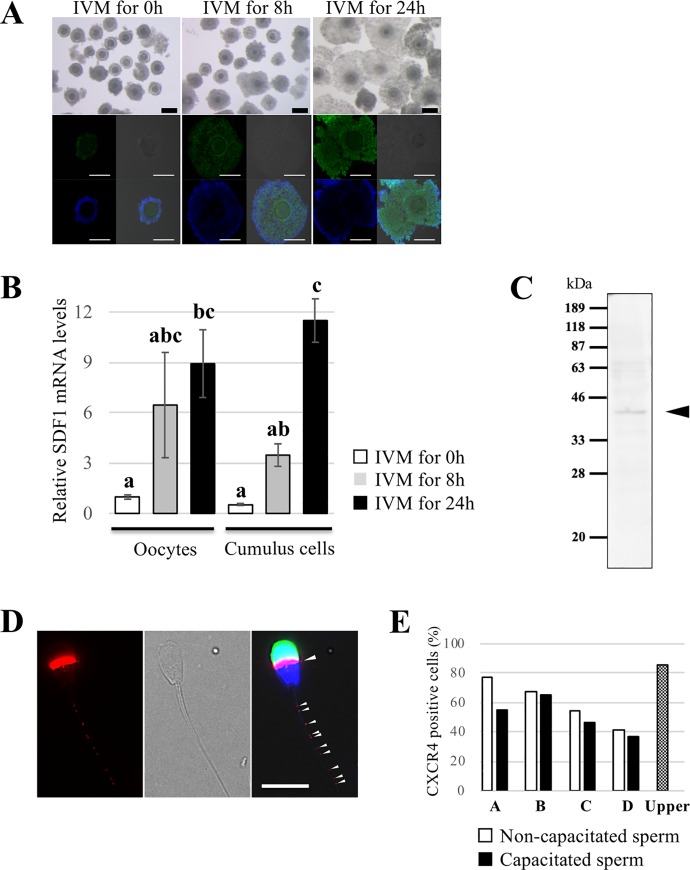
Fig 2. Detection of expression of CXCR4 in spermatozoa and SDF1 in COCs.
(A) Representative immunocytochemical images showing SDF1 localization and brightfield images of bovine COCs. Oocytes and cumulus cells were matured in vitro for 0, 8, or 24 h. Note the immunoreactivity detected in the cumulus cells and oocytes, and their expression levels increased during IVM. Blue: nuclei (Hoechst 33342); Green: SDF1. Bars = 100 μm. (B) Relative mRNA expression of SDF1 in oocytes and cumulus cells was measured by quantitative RT-PCR. Relative SDF1 mRNA expression was normalized to β-actin mRNA expression. White, grey, and black bars show relative SDF1 mRNA expression after IVM for 0, 8, and 24 hours, respectively. Data are shown as the mean ± SE. n = 3. Different letters indicate a significant difference (p<0.05). (C) CXCR4 expression was detected by western blot analysis. Black arrowhead indicates the specific band corresponding to CXCR4. (D) Representative immunocytochemical image showing CXCR4 localization in bovine sperm. Spot-like immunoreactivity at the tail of sperm and immunoreactivity at the equatorial segment were detected (arrowheads). Left: Image of the CXCR4 signal (red); Middle: Brightfield image; Right: Merged image. Red: CXCR4; Blue: nuclei (Hoechst 33342); Green: PNA. Bar = 10 μm. (E) Comparison of the CXCR4-positive cells rate between four semen from different mature Japanese Black cattle bulls (A-D) with or without capacitation treatment. White bars show the rates for non-capacitated sperm, and black bars show those for capacitated sperm. The rate of sperm in the upper chamber after the chemotaxis chamber assay is also shown.

