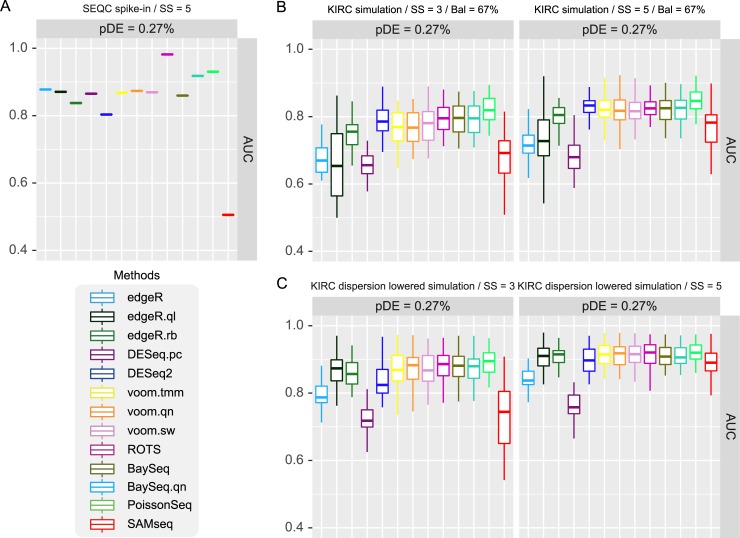
Fig 1. Performance comparison of 13 DE analysis methods for SEQC benchmark data and simulation data based on KIRC parameters.
Three and five samples were used in simulation tests. (A) SEQC spike-in data test, 5 sample condition, 0.25, 1.5, 2 fold changes are introduced to DE genes. (B) KIRC based simulation. 1.5 or larger and 1.3 or larger fold changes are introduced to 0.27% of 10,000 genes for 3 and 5 samples, respectively. (C) Same condition as B but fixed fold changes, 0.625, 1.15, and 1.3 were introduced to DE genes. Dispersions were also lowered to SEQC level (22.5 times).

