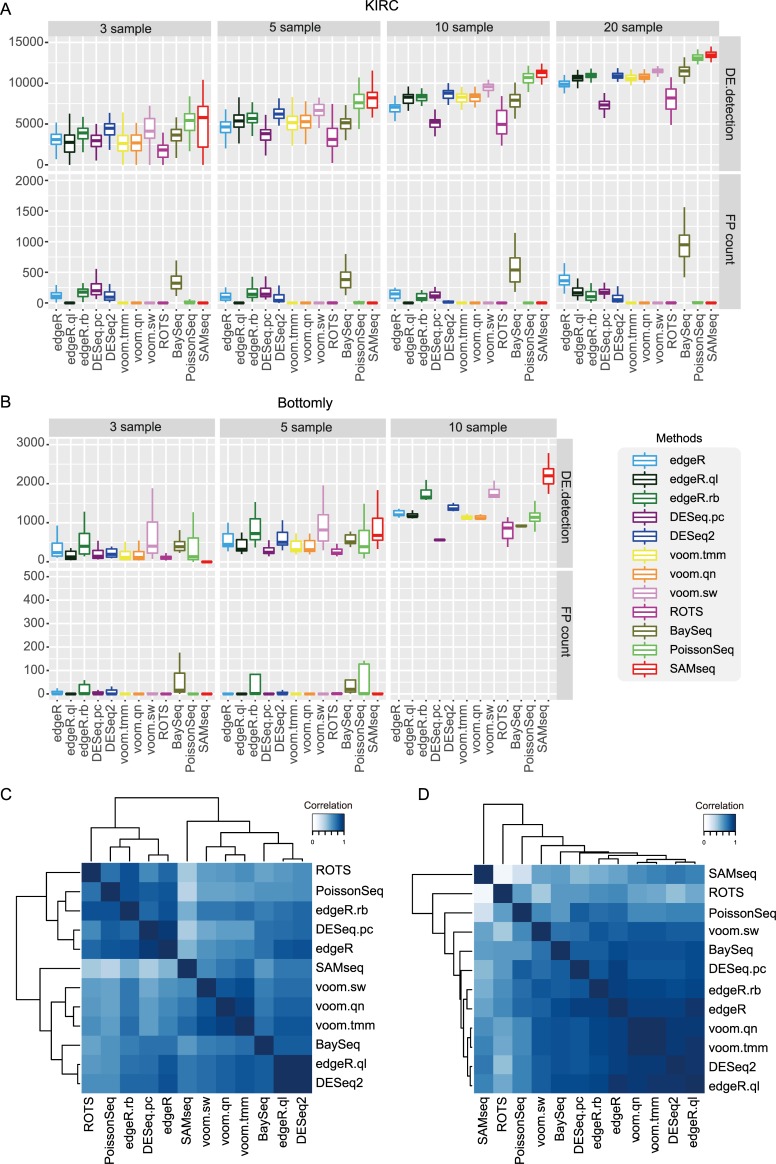
Fig 4. Analysis on KIRC and Bottomly.
(A, B) The number of DE genes between two sample groups and FP counts under varying sample sizes. (A) DE genes between normal and cancer sample groups and 3 to 20 sample size conditions were tested for KIRC. (B) DE genes between C57BL/6J strain and DBA/2J strain sample groups and 3 to 10 sample size conditions were tested for Bottomly. (C, D) Hierarchical clustering of DE genes obtained from 12 DE analysis methods based on spearman rank correlation. Top 5000 and 500 DE genes are used to calculate spearman rank correlation for KIRC and Bottomly datasets, respectively.

