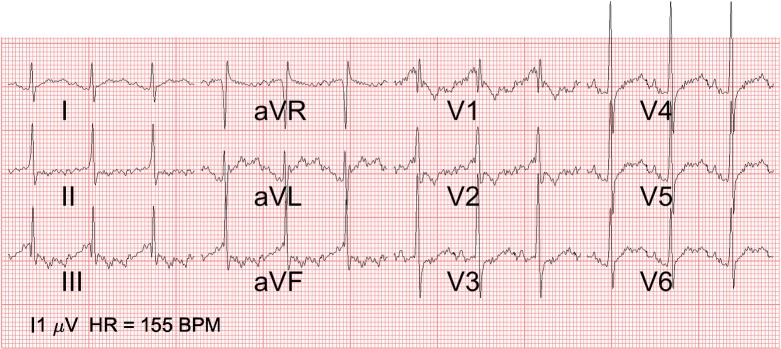
Fig 7. 12-lead fetal ECG of hypoplastic right heart.
12-lead ECG of case 2 with a hypoplastic right heart (hypoplastic right ventricle, tricuspid stenosis and dysplastic pulmonary valve): Note the abnormal QRS axis (+60 degrees) and left ventricular dominance (prominent R waves in V5 and V6). The marker on the bottom left indicates the scale at which an amplitude of 1 μV is depicted.

