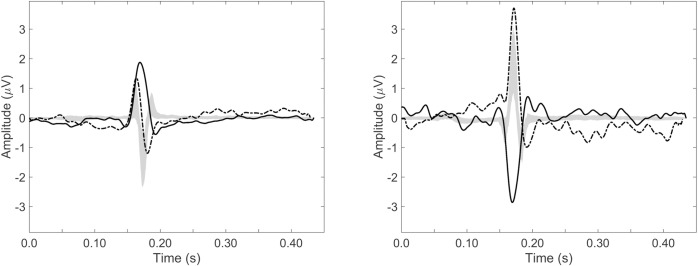
Fig 8. ECG of cases compared to normal ECG.
Leads I (A) and aVF (B) for the two CHD cases, plotted together with the IQR of the normal ECG. The gray area represents the IQR of the normal ECG, the solid line represents the fetus with atrio-ventricular septal defect (Fig 6) and the dashed line represents the fetus with hypoplastic right heart (Fig 7).

