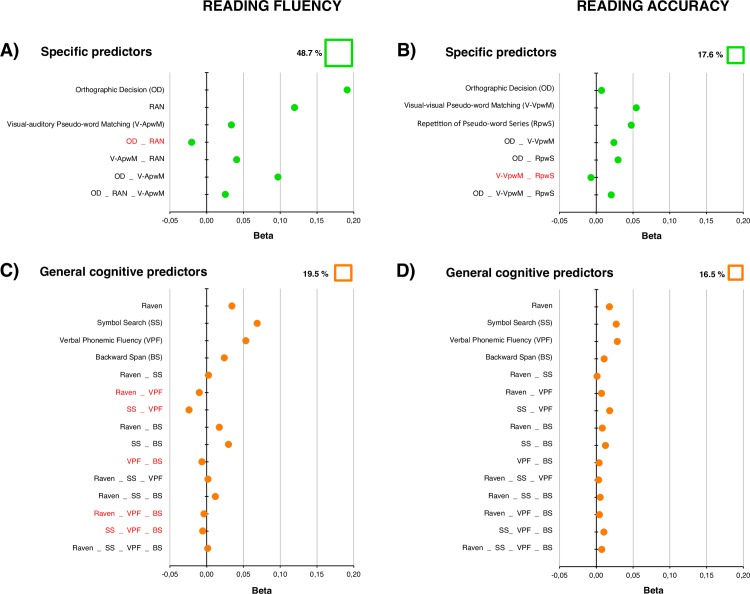
Fig 2.
Forest plots relative to models of reading fluency (A: MODEL 1 using specific predictors) and C (MODEL 2 using general cognitive predictors) and accuracy (B: MODEL 3 using specific predictors) and D (MODEL 4 using general cognitive factors). Each plot shows the unique and common influences of the predictors on reading. The percentage of variance accounted by each model is indicated on the top right of each plot. The sizes of the green or orange squares beside the percentage of variance are proportional to the total amount of variance explained by each model. The green and orange dots (for the specific and general cognitive predictors, respectively) indicate the size of the beta coefficients for the unique or common portions of variance. Negative values (and red labels) mark suppressive effects.

