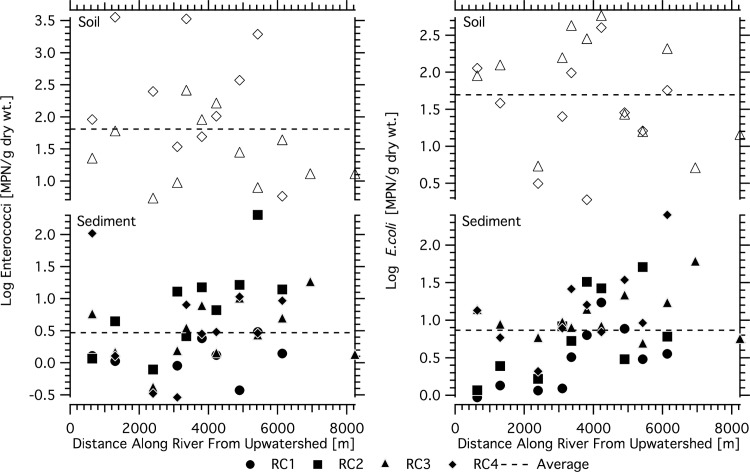
Fig 4. Spatial distribution of enterococci and E. coli in river sediments and soils of Hanalei River as a function of distance along the river from the river mouth.
Soil concentrations are shown in top panels (squares) and sediments concentrations are shown in bottom panels (circles). Horizontal dashed lines represent average concentrations in their respective matrices. The distance represents the along river distance from the USGS gauge.

