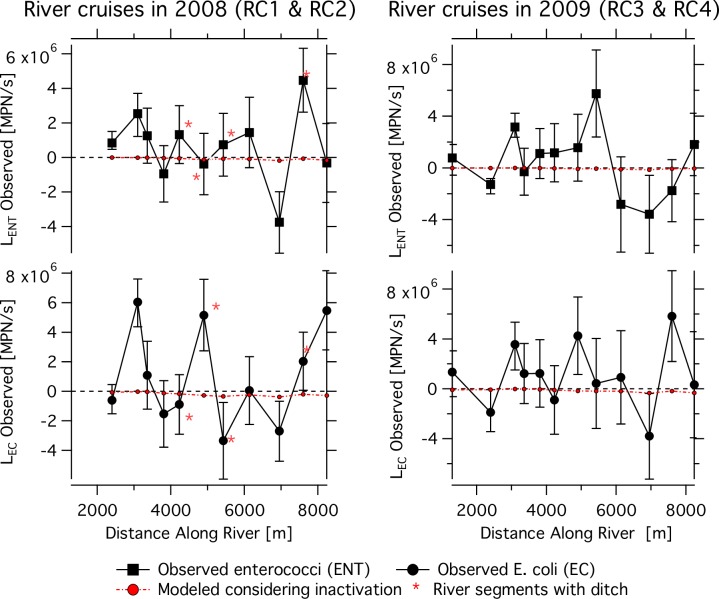
Fig 5. Observed and model loading results.
Hanalei river loadings in 2008 (left panel) and 2009 (right panel). ENT loadings (squares) are shown in the top panels and EC loadings (circles) are shown in bottom panels. Red lines show model predictions for changes in loading due to inactivation. Red asterisks indicate river segments where a ditch drains into the river. The asterisks are only shown on the left panels. The distance represents the location of the downstream end of the river segment.

