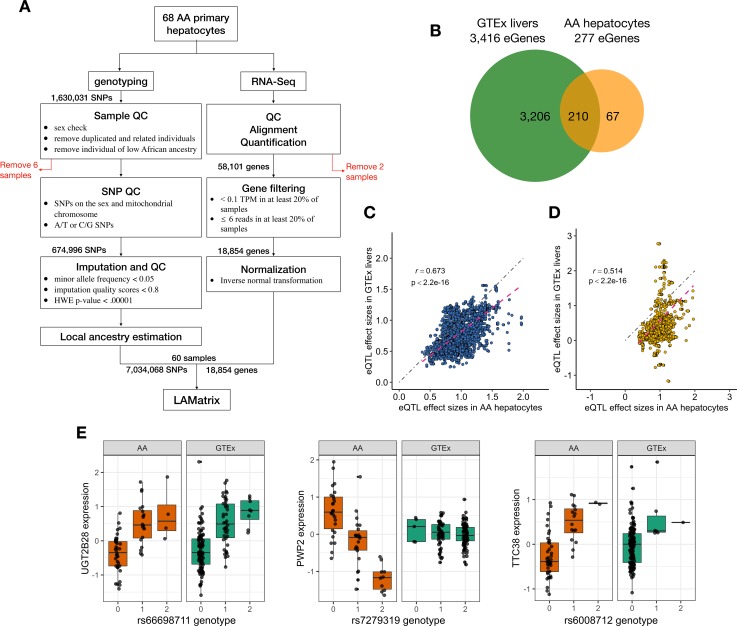
Fig 1. Comparison of eQTLs mapped in AA hepatocytes (n = 60) with eQTLs mapped in GTEx livers (n = 153, v7).
To determine if the eQTLs discovered in AA hepatocyte were unique to our dataset or previously identified by the GTEx consortium, we compared our findings with this publicly available dataset. All significant eQTLs presented met the following criteria: FDR<0.05 and MAF>0.05 in each dataset. (A) Flowchart outlining the study design and analysis. (B) Venn diagram of eGenes discovered in AA hepatocytes as compared to eGenes in GTEx liver. (C) Comparison of absolute effect sizes of eQTLs found in both GTEx livers and AA hepatocytes (Overlapping eQTLs, Spearman correlation = 0.673, p-value<2.2e-16). Dotted magenta line represents the fitted regression line and dotted grey line represents the diagonal line. (D) Comparison of absolute effect sizes of eQTLs found only in AA hepatocyte dataset (AA-specific eQTLs), showing a lower correlation as compared with overlapping eQTLs (Spearman correlation = 0.514, p-value<2.2e-16). Dotted magenta line represents the fitted regression line and dotted grey line represents the diagonal line. (E) Examples of eQTLs discovered in AA hepatocytes. In the first panel, SNP, rs66698711, was significantly associated with the expression of UGT2B28 in both GTEx and AA hepatocyte datasets (Overlapping eQTL). In the second panel, rs7279319 showed a negative effect on PWP2 expression in AA hepatocytes but no effect in GTEx livers (AA-specific eQTL). The third panel, rs6008712, (an AA-specific eQTL) showed a positive correlation to TTC38 expression in both cohorts but lacking statistical significance in GTEx due to the small MAF in the GTEx liver cohort.

