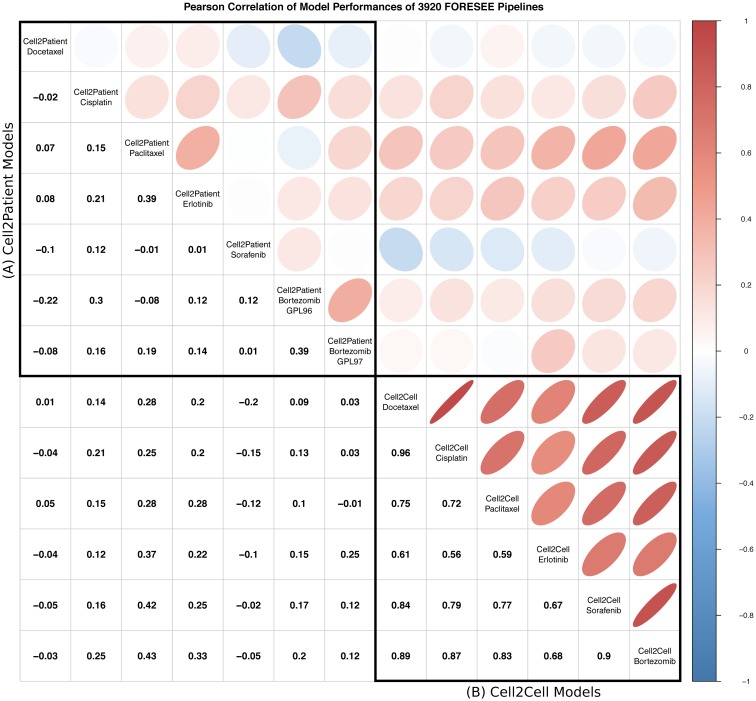
Fig 3. Pearson correlation of the performances of 3,920 FORESEE pipelines among the different cell line- and patient data sets.
Pearson correlation of the performances of 3,920 FORESEE pipelines for seven different patient data sets (A): GSE6434, GSE18864, GSE51373, GSE33072 Erlotinib cohort, GSE33072 Sorafenib cohort, GSE9782 GLP96 cohort and GSE9782 GLP97 cohort and (B) six different cell line model scenarios with data from GDSC for Docetaxel, Cisplatin, Paclitaxel, Erlotinib, Sorafenib and Bortezomib. The performance measure for the cell line-to-cell line modeling scenarios is the mean AUC of ROC of a 5-fold cross-validation for each drug.

