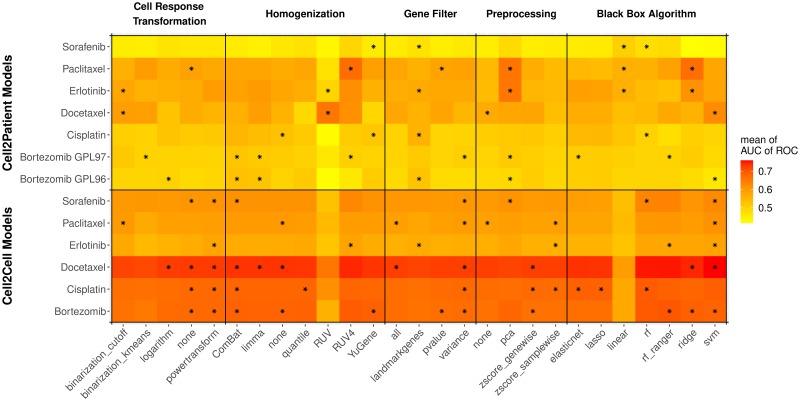
Fig 6. Heatmap of the performances of 3,920 FORESEE pipelines in the different cell line- and patient data sets averaged for model setting categories.
Heatmap of the performance of 3,920 FORESEE modeling pipelines tested with seven different patient data sets (Cell2Patient): GSE6434, GSE18864, GSE51373, GSE33072 Erlotinib cohort, GSE33072 Sorafenib cohort, GSE9782 GLP96 cohort and GSE9782 GLP97 cohort, and six different cell line model scenarios (Cell2Cell): GDSC data for Docetaxel, Cisplatin, Paclitaxel, Erlotinib, Sorafenib and Bortezomib. The performance measure for the cell line-to-cell line modeling scenarios is the mean AUC of ROC of a 5-fold cross-validation for each drug. The color depicts the mean AUC of ROC of modeling pipelines that comply with the corresponding model pipeline setting (x-axis). The black stars denote if a model pipeline setting is significantly enriched (p < 0.01) in the best 5% of all 3,920 modeling pipelines.

