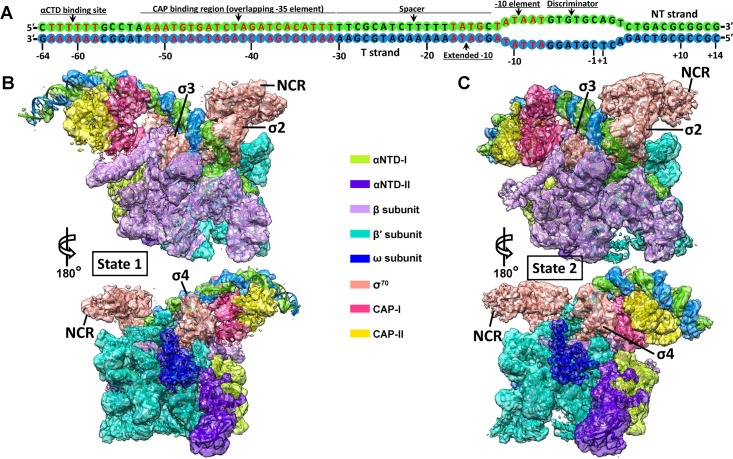
Fig 1. Cryo-EM reconstructions of the class-II CAP-TAC without RNA transcript.
(A) Schematic representation of the synthetic promoter DNA scaffold (78 bp) in the class-II CAP-TAC. (B-C) Overviews of the cryo-EM reconstruction maps of the E. coli class-II CAP-TAC without RNA transcript at 4.5 Å (B, state 1) and 4.3 Å (C, state 2) resolutions, respectively. The individually colored density maps, created by color zone, split in Chimera, and shown in a contour of 8 root-mean-square (RMS), are displayed in transparent surface representation to allow visualization of all the components of the complex. CAP-TAC, CAP-dependent transcription activation complex; cryo-EM, cryo–electron microscopy; NCR, non-conserved region; NT, non-template; αCTD, carboxyl-terminal domain of the alpha subunit; αNTD, amino-terminal domain of the alpha subunit.

