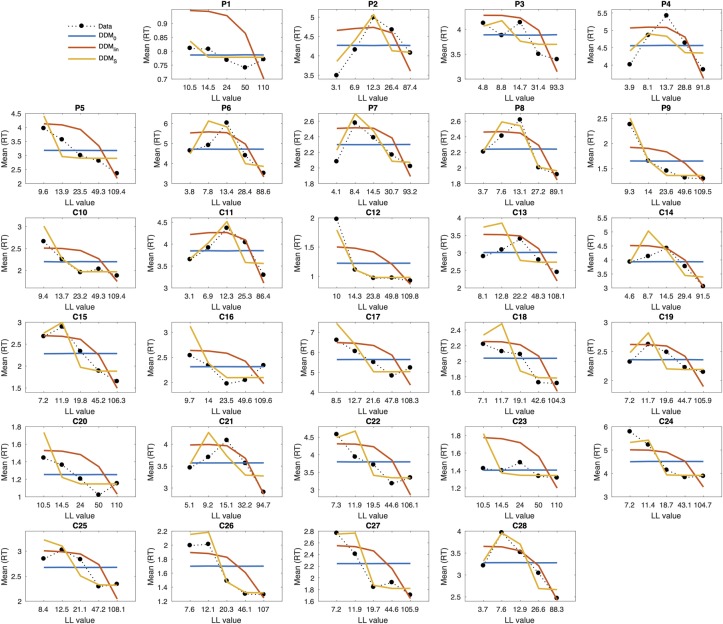
Fig 2. Posterior predictive plots for the different temporal discounting DDM models for all individual participants (P–mOFC patients, C–controls).
Trials were binned into five bins of equal sizes according to the subjective value of the larger-later (LL) option for each participant (calculated according to Eq 1). The x-axis in each panel shows the subject-specific mean LL value for each bin. The y-axis denotes observed response times per bin (dotted black lines) and model predicted response times per bin for the different DDM models (blue: DDM0, red: DDMlin, orange: DDMS). Model predicted response times were obtained by averaging over 10k data sets simulated from the posterior distribution of each hierarchical model.

