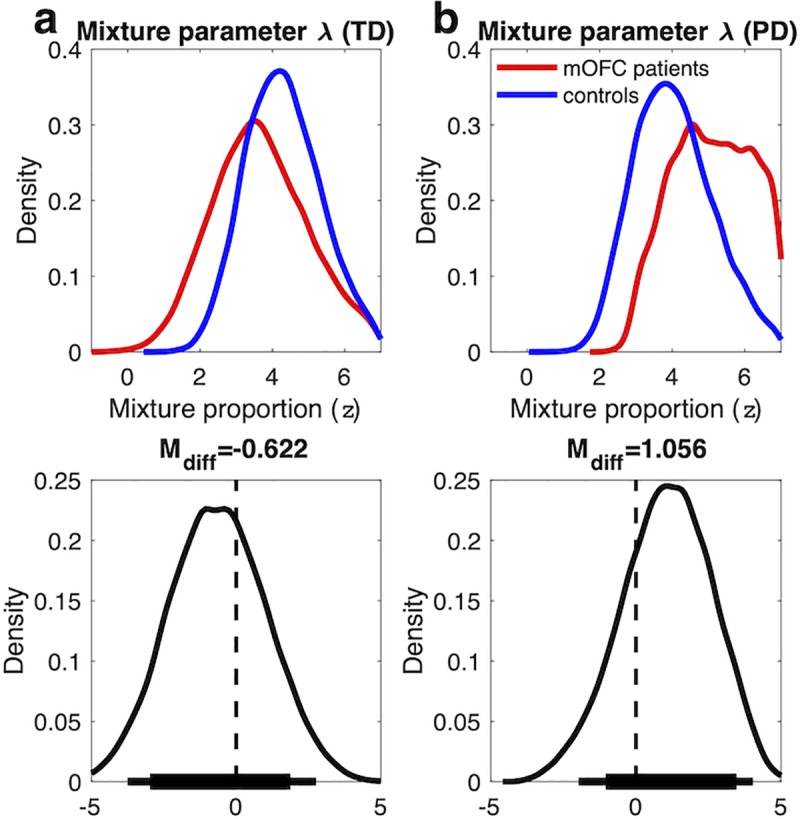
Fig 9.

Top row: posterior distributions of the mixture parameter λ (a: temporal discounting (TD), b: risky choice / probability discounting (PD)) in z-units. Positive values of λ indicate that a greater proportion of trials was better accounted for by DDMS vs. DDM0, whereas negative values indicate the reverse. λ was fitted in standard normal space with a group-level uniform prior of [–7, 7] and back-transformed on the subject-level via an inverse probit transformation. Bottom row: Posterior group differences (mOFC patients–controls) for each parameter. Solid horizontal lines indicate highest density intervals (HDI, thick lines: 85% HDI, thin lines: 95% HDI).
