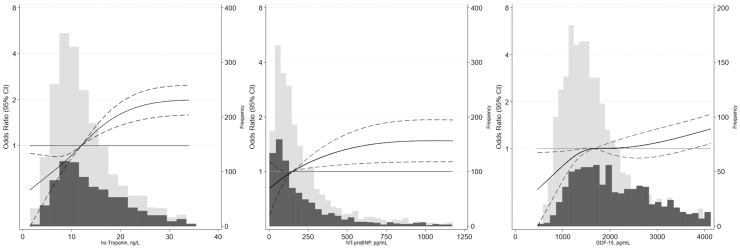
Fig. 1.
Adjusted odds ratios and 95% CIs for the continuous associations of cardiac markers with prevalent PN. Odds ratios are from logistic regression adjusted for age, sex, race and center, education, body mass index, smoking status, alcohol status, hypertension, hyperlipidemia, prevalent cardiovascular disease, and prevalent peripheral artery disease. Biomarkers were modeled using a restricted cubic spline with knots at the 5th, 35th, 65th and 95th percentiles. The models were centered at the 50th percentile, and the display of graphs was truncated at the 95th percentile. The light gray bars denote the distribution of participants without diabetes, and dark gray bars denote the distribution of participants with diabetes.

