
Figure 1.
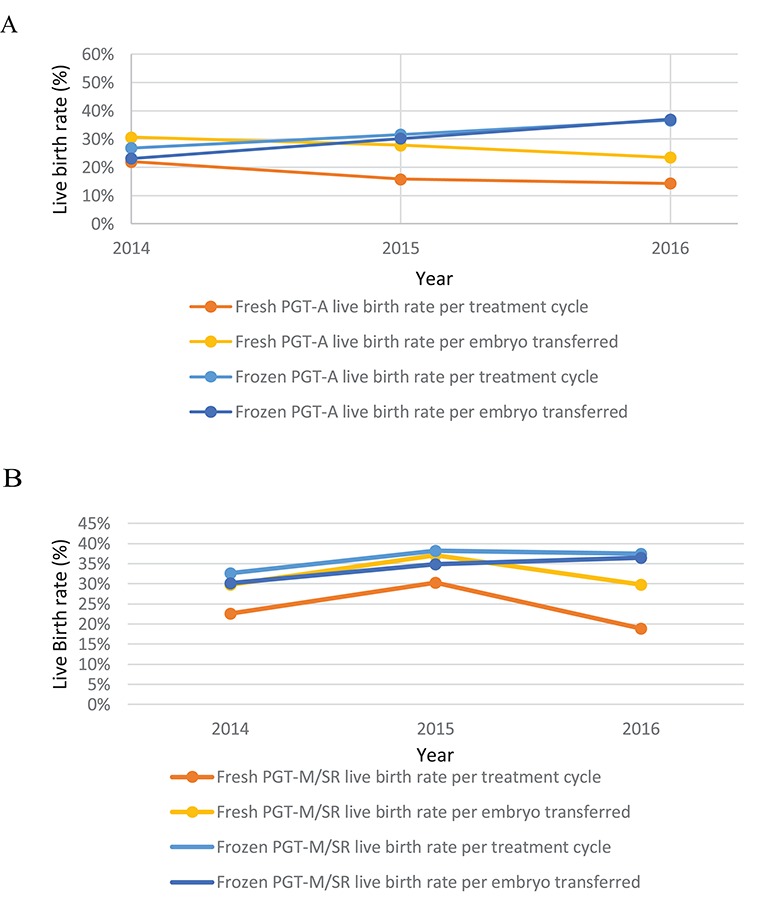
Data from the HFEA on the use of PGT for the years 2014–2016. (A) PGT-A live birth rates per year. For fresh PGT-A the live birth rate (LBR) per treatment cycle for the years 2014, 2015 and 2016 was 22.0% (72/327), 15.8% (63/400) and 14.3% (19/133) respectively. For fresh PGT-A the LBR per embryo transferred for the years 2014, 2015, 2016 was 30.6% (72/235), 27.8% (63/227) and 23.5% (9/81), respectively. For frozen PGT-A the LBR per treatment cycle for the years 2014, 2015, 2016 was 26.8% (15/56), 31.6% (61/193) and 36.6% (100/273), respectively. For frozen PGT-A the LBR per embryo transferred for the years 2014, 2015, 2016 was 23.1% (15/65), 30.2% (61/202) and 37.0% (100/270), respectively. (B) PGT-M/SR LBRss per year. For fresh PGT-M/SR the LBR per treatment cycle for the years 2014, 2015 and 2016 was 22.7% (58/256), 30.3% (46/152) and 18.9% (25/132), respectively. For fresh PGT-M/SR the LBR per embryo transferred for the years 2014, 2015 and 2016 was 29.7% (58/195), 37.1% (46/124) and 29.8% (25/84), respectively. For frozen PGT-M/SR the LBR per treatment cycle for the years 2014, 2015 and 2016 was 32.7% (115/352), 38.2% (204/535) and 37.5% (216/576), respectively. For the PGT-M/SR the LBR per embryo transferred was 30.2% (115/381), 34.9% (204/584) and 36.5% (216/592), respectively. HFEA: Human Fertilisation and Embryology Authority, PGT-A: preimplantation genetic testing aneuploidy, PTC: per treatment cycle, PET: per embryo transferred, PGT-M/SR monogenic defects/chromosomal structural rearrangements.