
Figure 2.
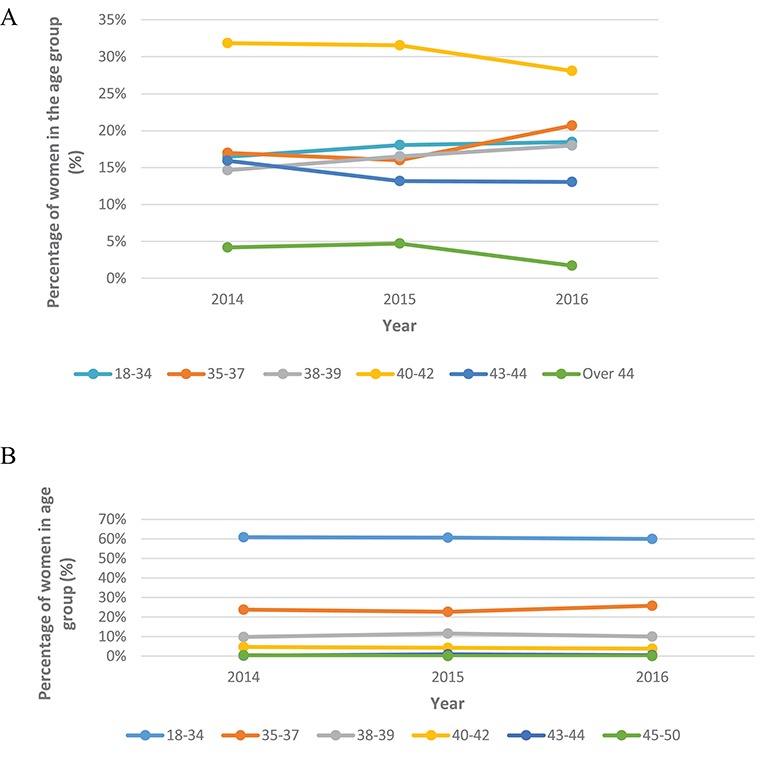
Data from the HFEA on PGT treatment cycles for the years 2014–2016. (A) PGT-A treatment cycles by age, per year. For 18–34 year olds the percentage of women in the age group from 2014, 2015 and 2016 was 16.5% (63/383), 18.0% (107/593) and 18.5% (75/406), respectively. For 35–37 year olds the percentage of women in the age group from 2014, 2015 and 2016 was 17.0% (65/383), 16.0% (95/593) and 20.7% (84/406), respectively. For 38–39 year olds the percentage of women in the age group from 2014, 2015 and 2016 was 14.6% (56/383), 16.5% (98/593) and 18.0% (73/406), respectively. For 40–42 years olds this was 31.9% (122/383), 31.5% (187/593), 28.1% (114/406), respectively. For 43–44 year olds this was 15.9% (61/383), 13.2% (78/593) and 13.1% (53/406), respectively. For the over 44 year olds for the percentage of women in the age group from 2014, 2015 and 2016 this was 4.2% (16/383), 4.7% (28/593) and 1.7% (7/406), respectively. Post-hoc tests were performed to show the 40–42 years age category was significantly higher than all other age categories (P < 0.001). The over 44 years age group made up the lowest percentage of PGT-A cycles (P < 0.05). (B) PGT-M/SR treatment cycles by age, per year. For 18–34 year olds the percentage of women in the age group from 2014, 2015 and 2016 was 60.9% (371/609), 60.7% (417/687) and 59.9% (424/708), respectively. For 35–37 year olds the percentage of women in the age group from 2014, 2015 and 2016 was 23.8% (145/609), 22.7% (156/687) and 25.7% (182/708), respectively. For 38–39 year olds the percentage of women in the age group from 2014, 2015 and 2016 was 9.9% (60/609), 11.5% (79/687) and 10.0% (71/708), respectively. For 40–42 years olds this was 4.8% (29/609), 4.2% (29/687), 3.8% (27/708), respectively. For 43–44 year olds this was 0.2% (1/609), 0.9% (6/687) and 0.6% (4/708), respectively. For the over 44 year olds for the percentage of women in the age group from 2014, 2015 and 2016 this was 0.5% (3/609), 0% (0/687) and 0% (0/708), respectively. Post-hoc tests showed the percentages of women in the 18–34, 35–37 and 38–39 year age groups were significantly higher than all other age groups (P < 0.001).