
Figure 5.
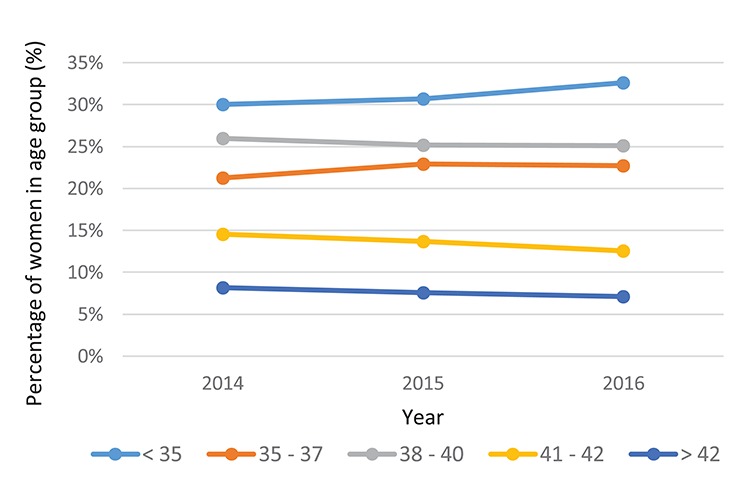
SART data—PGT treatment cycles (fresh and frozen) by age, per year. For under 35 s the percentage of women in the age group from 2014, 2015 and 2016 was 30.1% (4754/15 826), 30.7% (8099/26 393) and 32.6% (10 991/33 718), respectively. For 35–37 year olds the percentage of women in the age group from 2014, 2015 and 2016 was 21.3% (3365/15 826), 22.9% (6041/26 393) and 22.7% (7655/33 718), respectively. For 38–40 year olds the percentage of women in the age group from 2014, 2015 and 2016 was 26.0% (4111/15 826), 25.2% (6643/26 393) and 25.1% (8458/33 718), respectively. For 41–42 year olds the percentage of women in the age group from 2014, 2015 and 2016 was 14.6% (2304/15 826), 13.7% (3604/26 393) and 12.5% (4223/33 718), respectively. For over 42 year olds the percentage of women in the age group from 2014, 2015 and 2016 was 8.2% (1292/15 826), 7.6% (2006/26 393) and 7.1% (2391/33 718), respectively.