
Figure 6.
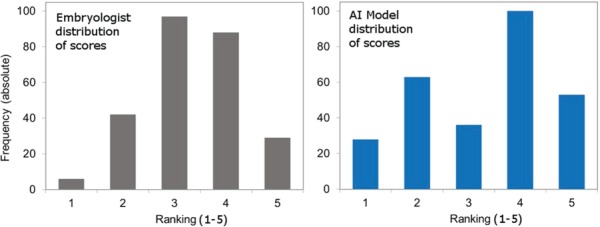
Distribution of viability rankings demonstrates the ability of the AI model to distinctly separate viable from non-viable human embryos. The left panel depicts the frequency of embryo viability rankings according to embryologist’s scores, and the right panel depicts the frequency of viability rankings according to AI model predictions. Results are shown for Blind Test Set 1. Y-axis = % of images in rank; x-axis = ranking band (1 = lowest predicted viability, 5 = highest predicted viability).