
Figure 9.
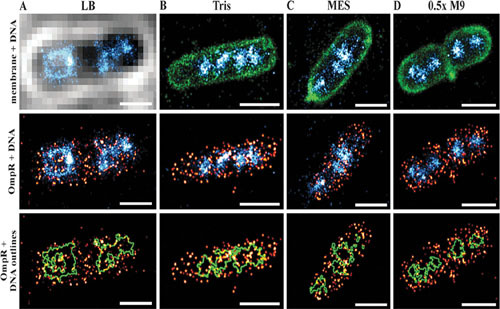
Sequential super-resolution imaging of OmpR-PAmCherry (red), bacterial cell membrane (green) and DNA (cyan) in various growth media: LB (A), 100 mM Tris pH 7.2 (B), 100 mM MES pH 5.6 (C), and 0.5× M9 buffer (D). Evidence for DNA compaction is evident in panels in the third row, where the green outlines the nucleoid edges. OmpR was distributed around the nucleoid edges (outlined in green) in LB, whereas it was more uniformly distributed in Tris buffer. In acidic (MES, pH 5.6) and hypotonic (0.5× M9) conditions, OmpR was recruited to the plasma membrane (scale bar = 1 μm). The number of images used for averaging cell length was 19 cells length 3.75 to 4.25 μm (A), 20 cells length 2.0 to 2.5 μm (B), 15 cells length 1.75 to 2.25 μm (C), and 13 cells length 1.5 to 2.0 μm (D). Reprinted from reference 39 under the terms of the Creative Commons CC BY license.