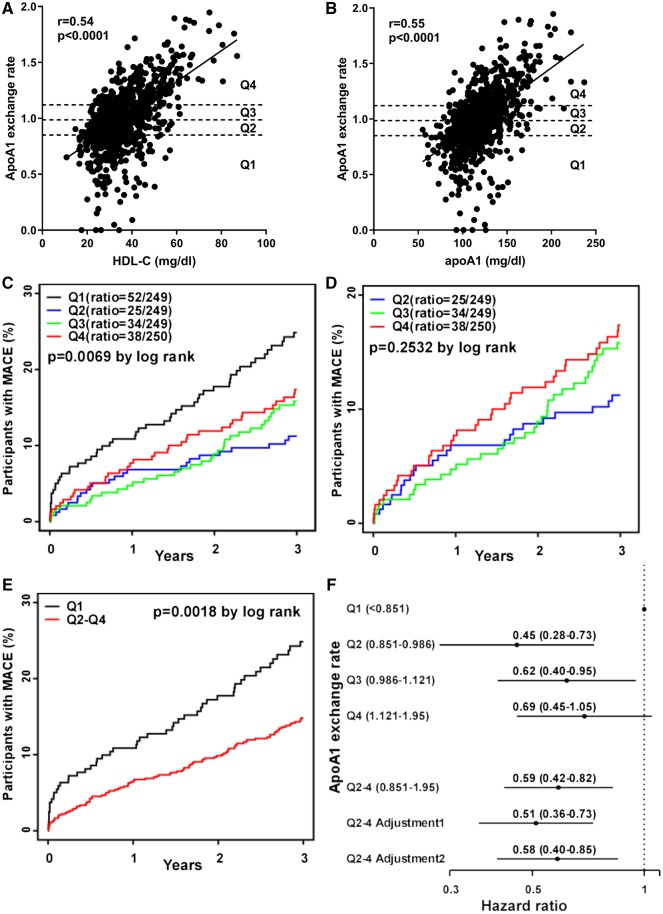
Fig. 4.
Low apoA1 exchange rate is associated with increased incident MACE. AER was assayed in 997 serum samples obtained from a Cleveland Clinic angiographic cohort with 3 years follow-up. The Spearman’s correlation of AER with levels of HDL-C (A) and apoA1 (B) were plotted (r = 0.54 and 0.55, respectively); the lines were calculated by linear regression. (C) A Kaplan-Meier curve for incident MACE over 3 years in the AER Q1-Q4 (black, blue, green, red lines, respectively) yielded a significant log rank order for time to MACE (P = 0.0069). The number of deaths after 3-year follow up: Q1 = 32; Q2 = 12; Q3 = 17; and Q4 = 25. (D) A Kaplan-Meier curve for incident MACE over 3 years in the AER Q2-Q4 (blue, green, red lines, respectively) yielded no significant log rank order for time to MACE (P = 0.25). (E) A Kaplan-Meier curve for incident MACE over 3 years for AER Q1 (black line) and Q2–4 (red line) yielded a significant log rank order for time to MACE (P = 0.0018). (F) Forrest plot of the HR between AER and MACE plotted from Q1 to Q4. Q2–4 were pooled for subsequent analysis, yielding unadjusted HR (95% CI) = 0.59 (0.42–0.82). Multivariate adjustment 1 included age, sex, BMI, smoking, diabetes mellitus, hypertension, CVD, myeloperoxidase, LDL-C, triglycerides, statin, and aspirin with HR = 0.51 (0.36–0.73). Multivariate adjustment 2 includes adjustment 1 plus HDL-C and apoA1 levels with HR = 0.58 (0.40–0.85).

