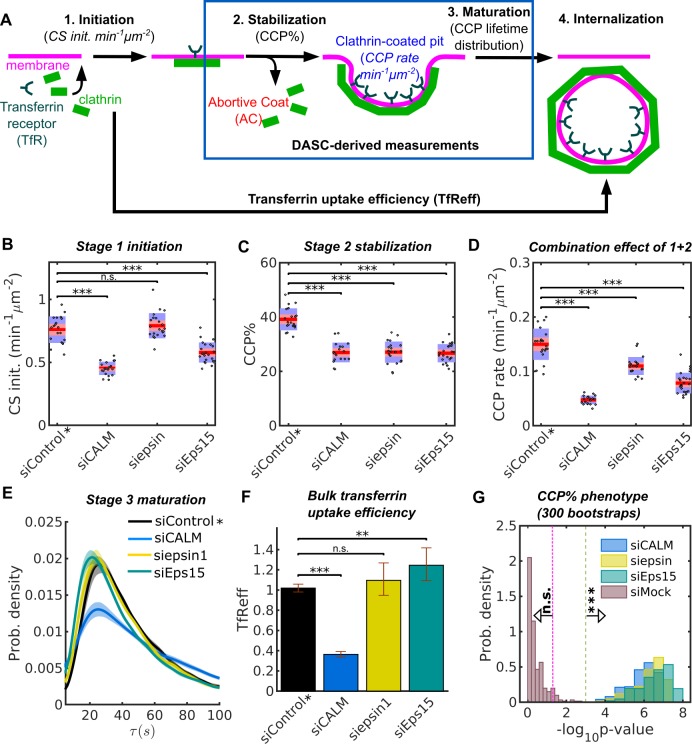
Figure 4. Stage specific phenotypes detected by DASC compared to transferrin uptake measurement.
(A) Schematic of 4 stages of CME: CS initiation, CCP stabilization, CCP maturation and CCV internalization. Stage 1-3 are quantified by CS initiation rate (CS init. in min−1μm−2), CCP% and CCP lifetime distribution. Bulk assays for transferrin receptor uptake (TfReff) measure CCV formation are not stage specific. CCP rate (min−1μm−2) measures the combination of initiation and stabilization. Effects of siRNA knockdown of CALM, epsin1 and Eps15 on (B) CS initiation rate, (C) CCP%, (D) CCP rate, (E) CCP lifetime distribution and (F) TfReff (internalized over surface bound transferrin receptors, error bars as 95% confidence interval and statistical significance explained in Materials and methods). 20 bootstrapped siControl movies from all experimental days as siControl* are compared to the specific siRNA conditions to obtained the DASC determined phenotypes in (B–D). (G) Probability distribution of of CCP% for 300 bootstraps. The 3 conditions in (B–D) plus siMock (20 more of bootstrapped siControl movies) are shown. Veridical lines indicates location of n.s. () and *** () significance. See details on data pooling in Materials and methods.


