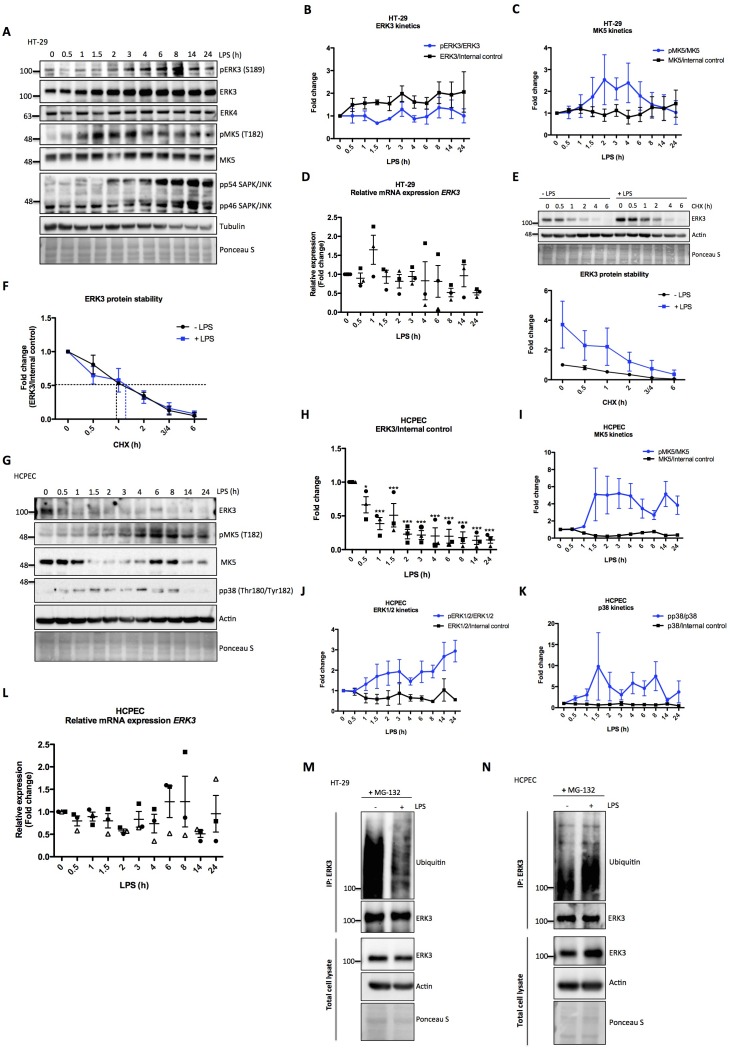
Figure 2. Effect of LPS on ERK3 expression and protein stability.
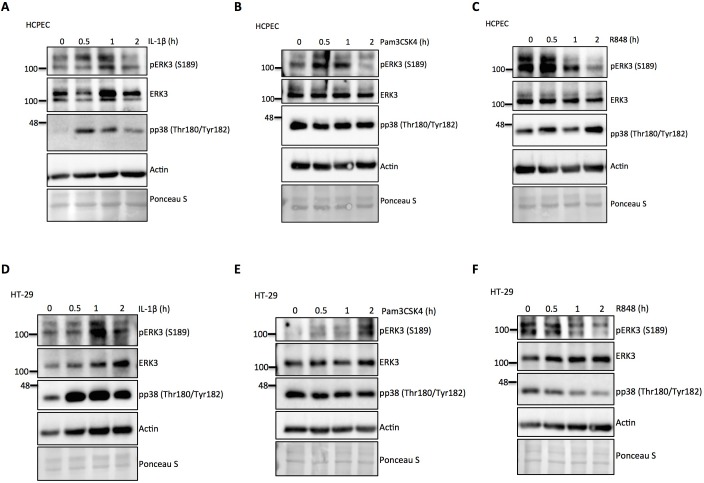
HT-29 cells and HCPECs were stimulated with LPS (200 ng/ml) at various time points as indicated. (A) Representative western blot analysis of HT-29 cells. Phosphorylation and/or total protein levels of ERK3, ERK4, MK5 and JNK were monitored. Tubulin immunoblots and Ponceau S staining were employed to monitor equal loading. (B) Changes in the expression and phosphorylation of ERK3 protein are shown as a fold change after normalization with internal loading control. Each time point was normalized to unstimulated cells (0). Fold change values from three independent experiments (n = 3) are represented as mean ± SEM. (C) Activation kinetics of MK5 in HT-29 cells stimulated with LPS. Fold change in MK5 phosphorylation levels upon LPS stimulation normalized to total protein levels and expression levels of MK5 normalized to internal loading control are shown. Fold change values from three independent experiments (n = 3) are represented as mean ± SEM. (D) Quantitative RT-PCR analysis of ERK3 expression. Each biological replicate was measured in triplicates. Log2 fold change in gene expression is presented as mean ± SEM of three independent experiments (n = 3); *p<0.05, **p<0.01, ***p<0.001, one-way ANOVA, Turkey’s post-test. (E) ERK3 protein stability was assessed by CHX chase at 0 hr, 0.5 hr, 1 hr, 2 hr, 3/4 hr and 6 hr in the presence and absence of LPS (30 min pre-treatment). Western blot analyses were performed and representative results are presented. ERK3 protein levels in respect to the untreated cells (-LPS, 0 hr) were calculated using ImageJ and data are presented as mean fold change ± SEM from three independent experiments (n = 3). (F) Graph presents ERK3 protein levels quantified in respect to the untreated cells (0) of unstimulated (-LPS) and LPS stimulated (+LPS) cells, respectively and data are presented as mean fold change ± SEM from three independent experiments (n = 3). (G) HCPECs were stimulated with LPS and immunoblot analyses of the phosphorylation and/or total protein levels of ERK3, MK5 and p38 were performed. Actin and Ponceau S staining were used as loading controls. (H) Plotted here are fold changes in expression of ERK3 protein. Results are shown as mean ± SEM fold change after normalization with the levels of internal loading control. Each time point was normalized in respect to unstimulated HCPECs (0). Data are a representative of three independent experiments (n = 3); *p<0.05, **p<0.01, ***p<0.001, one-way ANOVA, Turkey’s post-test. (I-K) Plotted here are fold changes in the phosphorylation of (I) MK5 at T182, (J) ERK1/2 and (K) p38 in response to LPS stimulation normalized to the respective total protein levels as well as the expression levels of total proteins normalized in respect to the internal loading control. Each time point was normalized in respect to the unstimulated cells (0). Fold change values are presented as mean ± SEM from three independent experiments (n = 3). (L) Quantitative RT-PCR analysis of ERK3 mRNA expression levels. Log2 fold change in gene expression is presented as mean ± SEM of three independent experiments (n = 3); *p<0.05, **p<0.01, ***p<0.001, one-way ANOVA, Turkey’s post-test. (M-N) LPS-mediated ubiquitination of endogenous ERK3 in (M) HT-29 cells and (N) HCPECs. HT-29 cells and HCPECs were seeded and treated as mentioned in the Materials and methods. Total cell lysates (TCL) and endogenous ERK3 immunoprecipitates (IP) were analyzed by immunoblotting. Levels of ERK3 and polyubiqutination were monitored. Actin and Ponceau S staining were used as loading controls for TCL western blot analysis. Results are representatives of at least two experiments showing the same tendency. ERK3 kinetics in response to other immune stimuli are presented in Figure 2—figure supplement 3).
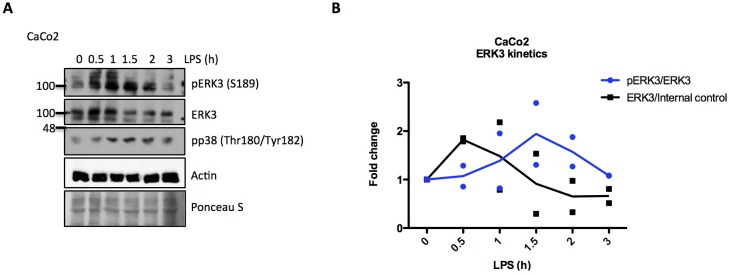
Figure 2—figure supplement 1. ERK3 kinetics in CaCo2 cells.
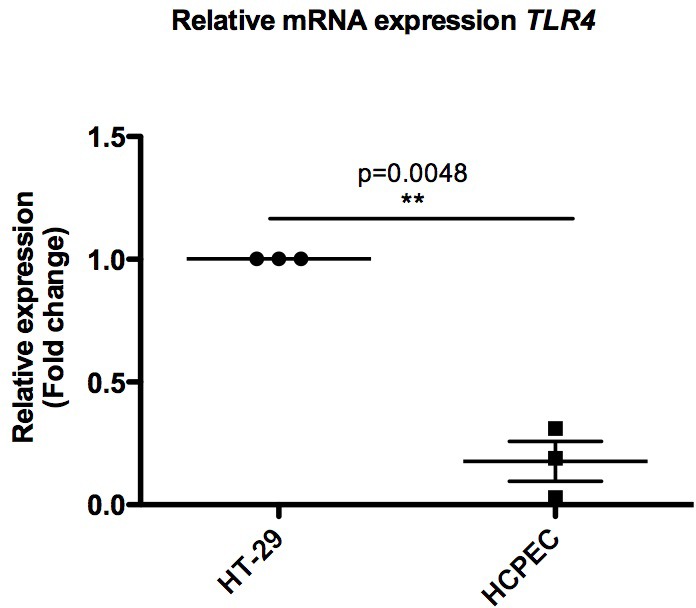
Figure 2—figure supplement 2. Graph representing relative mRNA expression levels of TLR4 in HCPECs when compared with HT-29 cells.


